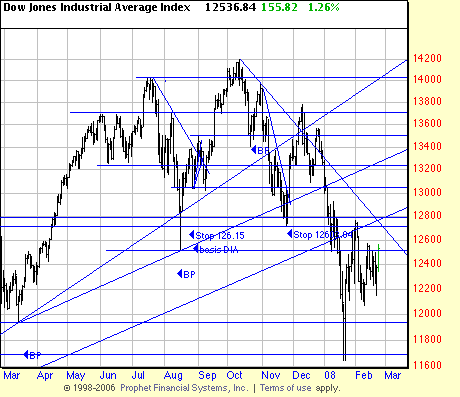
Mark Hulbert at marketwatch.com (one of our favorite columnists) remarks that newsletter advisors who have performed well in the past are largely bullish. These days when asked if we are bullish or bearish we reply that we stand firmly on the chart and the paper it is not written on. Our position, as we have noted is sideways. That said, how does the chart analyze? This might be a little triangle setting up in the Dow — marked below on the DIA.
Looks like three major trendlines are broken here.
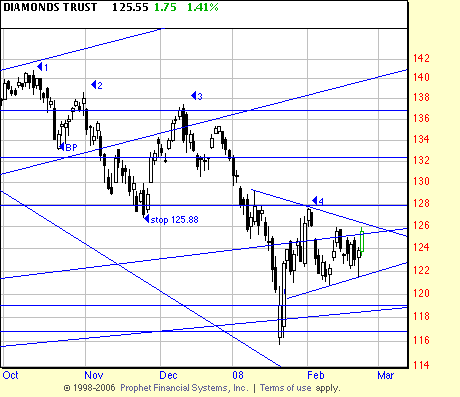
1 is the highest high. 1 to 2 is a completed downwave. 2 to 3 is a completed wave, as is 3 to 4. The little triangle is marked here. Does this appear an auspicious pattern of lower highs and lower lows? No. (No it’s not auspicious. Yes it is a pattern of downwaves.) Does this augur ill for the Dow? Yes.
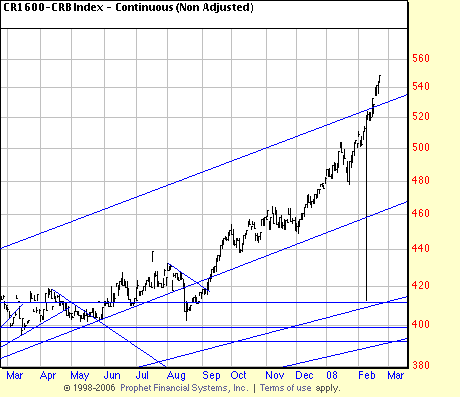
The CRB. That line in Feb is probably bad data. That uptrend is probably bad news for the economy.
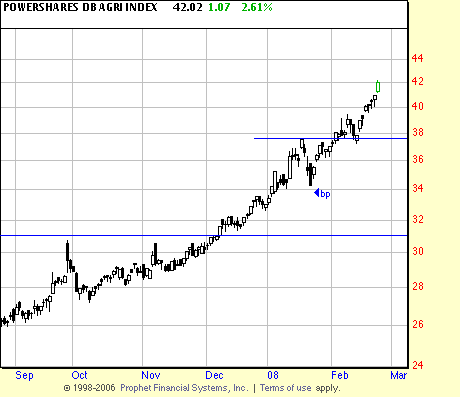
DBA is a way to track the CRB and agricultural commodities. A good hedge for a portfolio.
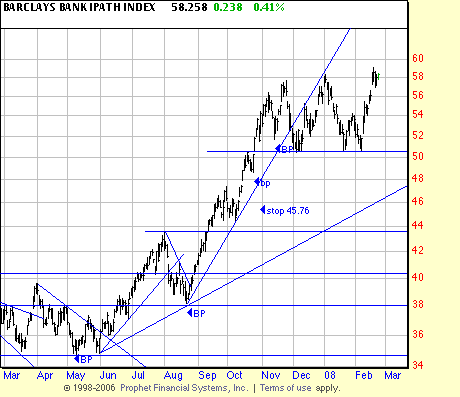
OIL still a good bet and a good hedge. At the top of the trading range, not yet broken out. but as can be seen from this chart there has been no exit signal in this market.

