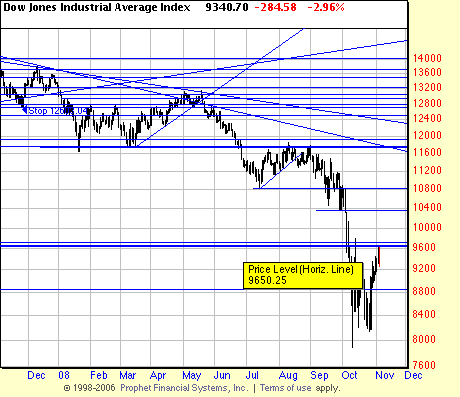
Yesterday, looking at the chart of the Dow We were prompted to ask ourselves what that horizontal line was at 9650.25.
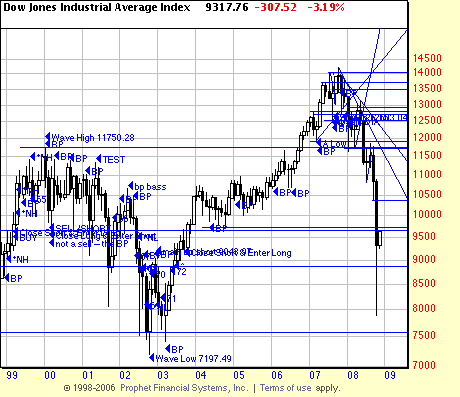
So we zoomed out and this is what we found:
That is an ominous horizontal trendline which represents the support line for the 2000 bubble, and thus, the resistance line for the present market. This observation was made early in the day as can be seen from the charts. So the sell off was of little surprise to us, as is the market’s action today.
These long term support and resistance lines can be surprising in their strength. Magee observed that he had seen lines thirteen years long exercise influence over the market. Given the overhang of all that activity above the line we would be pessimistic about the upside of the market for some time — perhaps years. There we go again, as Ronald Raygun would say, forecasting.
Machs nichts, as Chancellor Erhard said. We know what to do right now so forecasting is only necessary insofar as a grand investment strategy is desired (as le grand Charles a dit). In the near future we will be addressing this question.
For now we may marvel at the apparent accidents of chart analysis–the market running up against a lineeight or nine years old. Except that we see this kind of synchronicity too often to regard it as an accident.
This letter will be entered into the Nobel competition for investment writing classics.


