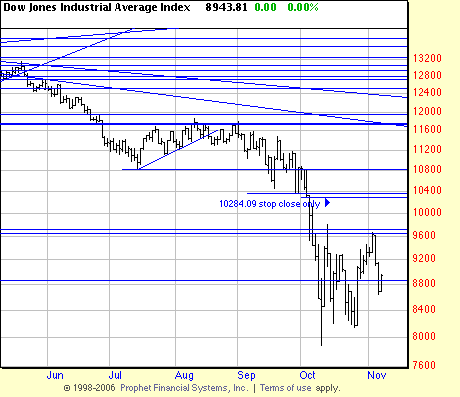
 Measuring from the wave high in August to the wave low in October the wave was a 33% decline. The automatic bounce to October 14 recovered 24% of that, and on November 10 the Dow is down 25% from the wave high. The automatic bounce actually appears to count as a rally or upwave (2 days!). It is also a basing point as may be confirmed from subsequent behavior (or misbehavior, as Mandelbrot would say). That is a point of 9794.07. A 5% stop calculated from that point would be as illustrated here.
In our Dow studies we have often used a 3% stop on the short side, which has produced good results, capturing more of the profit. But the present markets are so psychotic that we could see a rally reaching up and tripping the stop then plunging through the floor.
We’re not enamored of this stop, but it is the system stop. Not enamored because this market is so crazy that even adhering to a system seems crazy. But, you know, when the going gets tough the tough set their system stops and gt going to lunch (or a bar).


