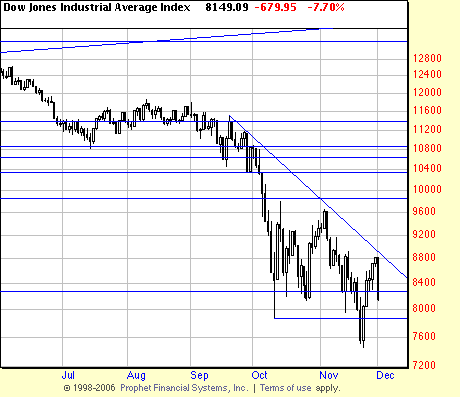
December 1 2008 The Dow takes a 7.7% dive. This is a surprise? No. What’s a surprise is the abruptness of the down draft after the up draft of last week.
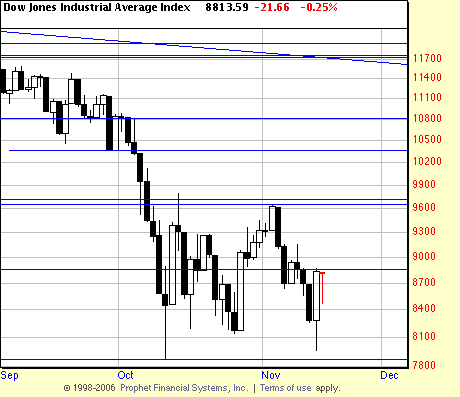
Here is where we left the Dow measuring waves on November 14:
The pattern is, 2 day wave to high after the panic. 2 day downwave. 3 day upwave to lower high. 4 day downwave to lower low. 6 day upwave to lower high. 7 day (so far) downwave to lower low.
As of December 1: The 7 day downwave carried on for 12 days. A vicious upwave went on for 5 days — an unusual length and percent, and it appeared that the rally had started. But on December the 1st the Dow dived by 7.7%. The downwaves get longer and stronger, and the upwaves get shorter and weaker. An ominous sign for the market. At the moment contrarians and bears are in a death struggle for control of the market. The need to “buy the bottom” and the downward momentum of the market are in the balance, and in the nitty gritty of the wave patterns the bears are winning at the moment.
There is no indication that short positions should be abandoned. And traders and investors should realize that any long positions taken here are bottom fishing. And lottery ticket buying. But, hey. Everybody needs a little amusement from time to time.
November 14 2008. Getting Technical
Remember. We don’t forecast. And when we do we don’t stand behind our forecasts. So in the spirit of not forecasting we wondered what might happen if the Dow took out the lows at 7197 (basis 2000 bubble). Speak of looking into the abyss.
Note line at 7197. Note lower line around 5800. There is some support down to 6400. After that it is lemming territory — as in jumping off the cliff to about 5800. And some Republicans are talking about letting Ford and GM go into bankruptcy. If you want to see a Dow at 5800 we should try that economic strategy.
What are the probabilities that might occur? Frighteningly, about 50/50 we would say. Breathtaking. A presidency which managed to bring down the world economic order. At this moment in the tipping point here is what the Dow looks like:
The pattern is, 2 day wave to high after the panic. 2 day downwave. 3 day upwave to lower high. 4 day downwave to lower low. 6 day upwave to lower high. 7 day (so far) downwave to lower low. This may be significant — you could say it’s not a promising pattern. It may just be part of a reversal or a continuation. Right now we don’t know. And neither does anyone else. What we do know is that the economy is in a truly grim state and Washington is fiddling around. Like Nero.


