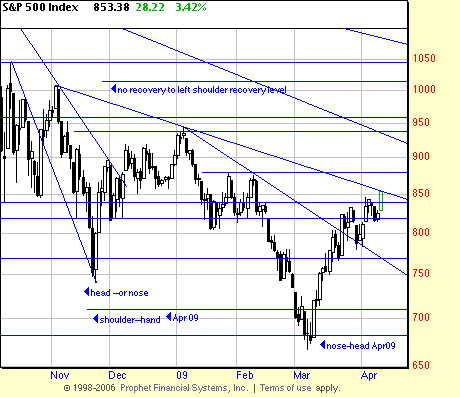
We often admonish our graduate students not to over interpret or pre-interpret patterns in the market. We tell them to beware of seeing bunnies (or other phantasma) in the clouds. Keep it simple and allow the patterns to manifest themselves. They will. But it’s so much fun trying to guess what’s in the Easter Bunny’s basket! Remember –as Nils Bohr said prediction is all right if you don’t take it seriously. Eager bulls have been trying to find a bottom in these markets for months. Back in December we posted the SPX chart on a chat group we belong to. The members had been muttering restlessly that a head and shoulders (Kilroy) bottom was present or would be shortly. We pointed out that the right side recovery had not reached significance (marked on chart). We find ourselves at somewhat the same position at present. Some of our readers are seeing a KB H&S setting up here from January to present. This is possible but still unresolved. It is also possible that the recent low is the nose (head) and that a massive bottom is being formed. The left hand and nose are already present. It seems to us that this is the more likely scenario because this would put a recovery months down the road. That seems more in line with economic fundamentals and the lamentable state of the economy.
Addressing the question of the Jan-Apr KB H&S, the left shoulder/hand had 22 days, followed by the final downwave of 14 days. The upwave has lasted 24 days to this point and is in the area where a right shoulder/hand would form. Remind us — when is Chrysler supposed to go bust or be rescued from the train tracks by an Italian knight errant (a la Perils of Pauline)?


