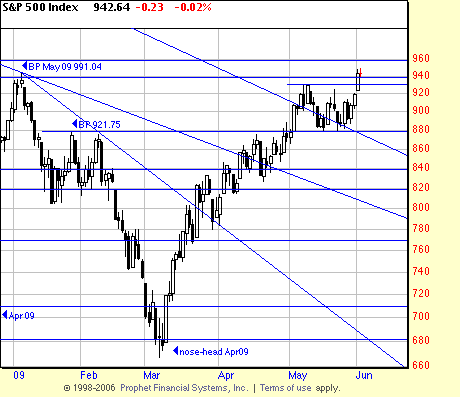
Against all reasoning the market has broken out of its range and appears headed higher. We have already commented that portfolios should be hedged with well chosen longs. We are liquidating our personal S&P shorts. But we are not buying the indices yet. We are presently evaluating the implications of changes in the composition of the Industrials. The technical case for an upthrust here are that it would be nice to see prices reach the neckline. Irregardless of the economic realities, which are in direct contradiction to market behavior, Friday’s strange up surge — we’ll post a chart soon– and today’s action leave no doubt that the buying is on. No need to stand in its way. If the bear comes back we can always get short again.


Did we really break the neckline yesterday? I see the neckline being at about 930 (s&p500) & we’re at 942. That’s only piercing it by a little over 1% & on pretty average volume yesterday. Something about this feels like May 2008 going the other direction. We had a H&S Top neckline at 1400 we’d broken in Jan 2008 to a temp low of 1280 in March. Then it came back to 1429 and I second-guessed myself. I still have a hard time believing we won’t make the right side of the kilroy before we’re really back in bull mode….in my opinion, we don’t have kilroy completion until we’re 3-5% above it (960-970) on strong volume.
no the neckline is not broken. but the spx has just pulled even with the other hand/shoulder. What was broken was the little rectangle or congestion we have been in for some days. May well be a bull trap. In fact that’s my supposition, but you have to trade the chart. I too think there will be another leg down, but that’s thinking, not analyzing. As you see in the chart the change of trend signal is up there at 991. Given the insane volatility in these markets even that may not be a true trend change signal.
Thanks for the clarification.