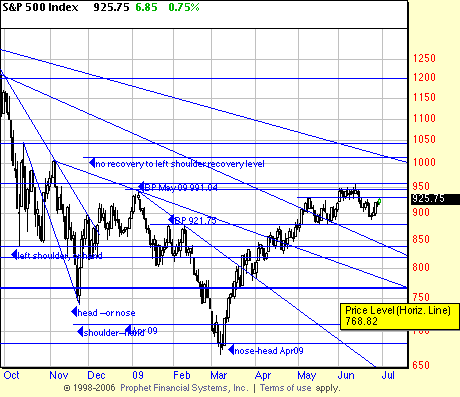
The horizontal trend line (we often call them signal lines) under the present formation (878.92 on our chart — ignore the yellow box with the 768.82 in it) is right on the top of Basing Points we identified months ago.
As Carl Jung would say, synchronicity. These presumptively accidental phenomena occur too often in chart analysis to be mere accidents. This line would ordinarily act as support for prices. It may also be the neckline of a head and shoulders top to this bear market rally. Also pointed out by some of our sharper ex-students.
What a pleasure it is when your alumni start doing your work for you and you just have to review and certify it! As everyone knows, we are short. Penetration of the signal line would start a slide of some consequence.
The book says (and it is true) that you’re supposed to wait for patterns to resolve before betting on them, so it is true that the most conservative bet here is waiting for penetration of the signal line. But who wants to play it safe all the time? Just those boring old solvent investors.

