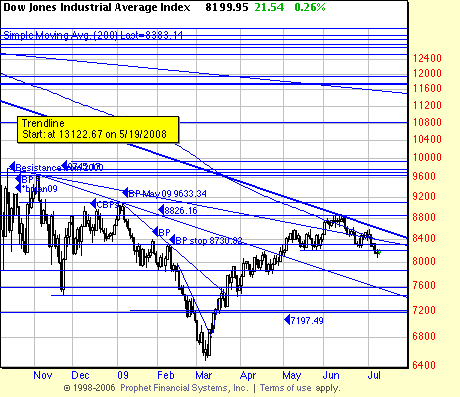
We coulda, shoulda, woulda commented in our last letter about an important feature of the Indu chart here. That is, a pattern of lower highs and lower lows has been established. It is not a downtrend of much strength yet. But the facts continue to pile up predicting lower prices.
There is a curious lethargy to the market. Perhaps it is because all the important traders are in the Hamptons (or in jail). Or maybe they’re out of money because their customers took back their capital.
Or maybe it’s just the dog-eat-dog days of summer.
Anyway some facts perhaps of interest: From panic low to panic low there were 80 days (m/l (more or less)). The present wave is 94 days and counting. From the low to the high of this wave there were 75 days. What we make of this is that the downwave is overdue and could be of some severity.
There is not a scintilla of doubt that the rally since March is 100% technical. Those who saw “green shoots” and “the light at the end of the tunnel” and “the tide turning” and “the pie in the sky” were deceived by contrarians and traders who used their naivete to fuel their profits. This is the way of the world, and the way of Wall Street. The strong eat the weak. And sometimes the strong get eaten too– what was the name of that famous tough guy firm.. Bear what? Lehman who?

