The time has come the cabbage said to speak of many things, of jabberwocks and cribbage, of bings and kings and ringa ding ding…

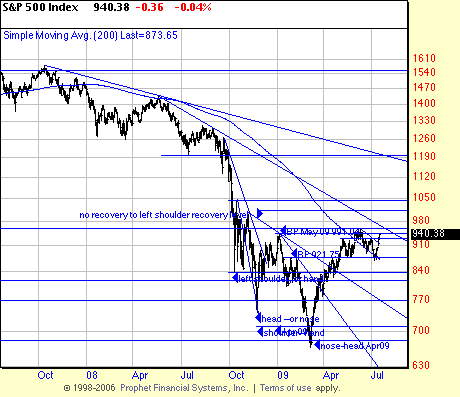
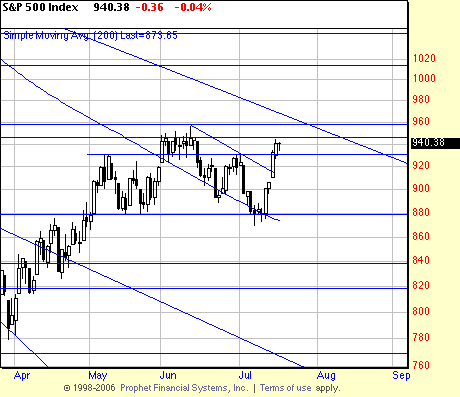
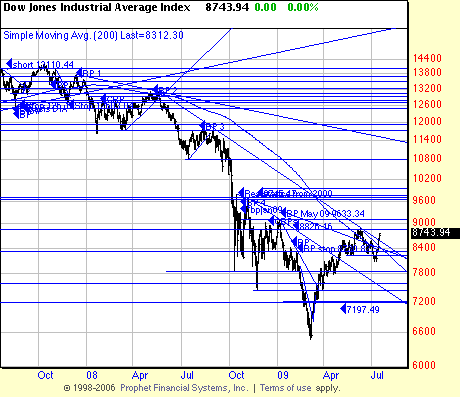
 Here’s the surprise. The S&P jumping across that little trend line is an aggressive signal for the risk hungry and the performance chaser. Sometimes we are, sometimes we’re not. Adding to the strength of this signal is the downwave that preceded it and, in the Indu, took out the neckline of the putative head and shoulders. (A false signal is often followed by a significant and important signal.) At the time we pointed out that a definitive break of the neckline had not occurred and waited for later developments. The definitive break never occurred, and the Indu was in worse shape than the SPX.
 What is our take on all this — an apparently valid head and shoulders now apparently being canceled by a 7% week in the Dow. As an upwave can be followed by a downwave so can it too be followed by a sidewave, so this formation can morph easily into a trading range or rectangle.
Well, sometimes it’s too dangerous to go in the water. For investors we would be watching our positions with well analyzed Basing Point stops. For traders, go for it with full realization that everything happening here is a crap shoot, and stops should be up tight (and maybe the psychological attitude too).
Now here is the amazing thing: Forget the head and shoulders. This entire upwave from March 10 can be considered an intact upwave, with the apparent head and shoulders a part of the downwave. If the June high is taken out — as it appears it might be — we have one long continuing upwave. Pretty surprising. So now the question is what’s the news the coming week.
What do we really think of this? Well it is entirely appropriate that a historic downwave and panic sell off be followed by a historic rally. But what we really think is that it is a bull trap of massive proportions.
And we are in the eye of the hurricane.


Do you think that $GOLD will keep following the indices, or will it decouple and break the $1000 level as indices finally head down?
Here is where I am at: $Gold starts to trade in a triangle 1008/860. The upper trend line is the 1034 high, March 08. If this line is not broken, I will consider it to be a sign of weakness. An other indicator to support above is, the high of the 1034/1008 trend line was not reached last June.
A close below SMA200, would may be justify taking some shorts.