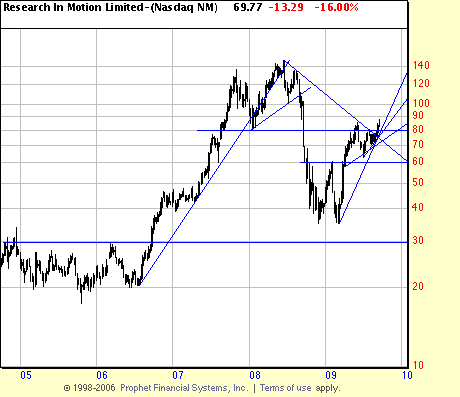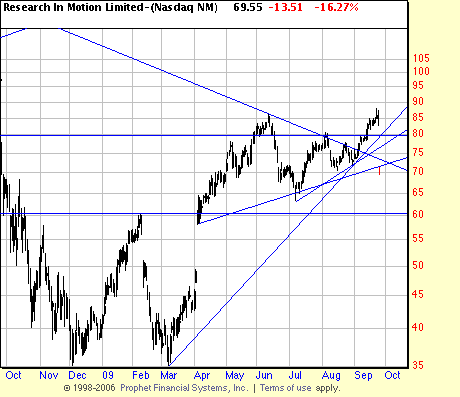
RIMM is a chartist’s dream. Look at this chart. It’s a theoretical wonder. Talk about dependable signals. In ’06 it breaks out of a consolidation formation on power bars, booms up, forms a flag (or pennant), powers out of it, forms a double top with a perfect neckline (as wll as an upsloping trendline, breaks it and craters, forms double bottom with great neckline, breaks out and finds resistance just around the old neckline. If you didn’t know better you might say the invisible hand of the market is drawing this to validate all the material in Technical Analysis of Stock Trends, 9th Edition.
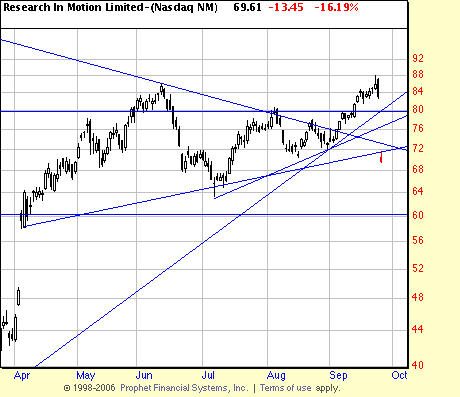
 Right about the time it ran into the resistance line it ran into the iphone. And formed what might be called a double top. Then made a historic gap. As may be seen a number of important trend lines are broken with this gap.
 Some of my ex students amuse themselves by calling this the “gap of death”. Looks like a short to us. We’re saving the chart for teaching purposes. The true basing point here is the high before the gap, but that clearly is too large, so the stop is 5% over the high of the gap day.

