Wave Analysis of the Dow from several dates — October and November
10/22/09

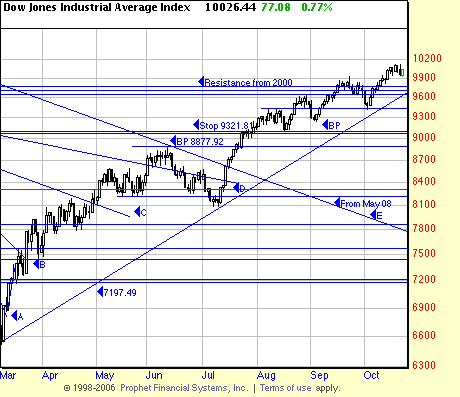
Since March 9 the Dow has made an orderly march upwards, if not an April upwards. Wave studies are always interesting so it is interesting to observe what is happening here in the march, and also in this October.
The first wave rolled 47 days, and was followed by 23, 10, 14 and 12 (current, not necessarily finished) days. As previously observed these wave patterns have taken the form of surge, drift, flush and surge. Currently we are wavering between drift and flush. So some flushing here would get rid of nervous arrivistes and encourage those shifting uneasily on the sidelines hoping for a major downwave.
In the meantime here is what we think is happening: Nervous money is trickling back into the market bit by bit. This is positive.
And we are really desperate for some well chosen shorts to keep our portfolio naturally hedged. We’re beating the bushes (the George sr and the George jr bushes) for them.
And remember — when in doubt the trend tends to continue.
11/17/09

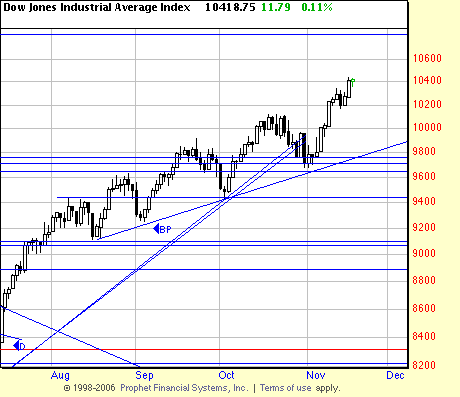
We can begin to see the trend rounding over now that we are in November. Interestingly the trendline from the absolute bottom in March has been broken. This is not necessarily a matter for concern. Trends which explode and rocket upwards at their inception always calm down and assume a more reasonable angle in continuation. We deal with this by drawing new trend lines. Here the new dominant trend line is drawn from August. We can see that it predicts a calmer ascent.
On the other hand if price should take out a couple of Basing Points here then we would have an entirely changed situation. The broken trendline would assume paramount importance. At this moment there does not appear to be any real danger of that but trend reversal can start at any time.
Here is a spread sheet which shows the wave analysis. As may be seen the last three waves lasted 10 to 14 days. Monday, on the 11th day of this wave we expected to see the beginning of drift we saw a power bar instead, along with gaps in the precious metals markets. These seemed pretty strong buy signals.
We apologize for the presentation here, but the substance of the table represents considerable time and effort and reader possession of the table will permit the enlightened reader (all of ours) to see from whence proceeds our decision making.
If you should attempt to corroborate the details be warned that we count beginning and ending days of waves twice. Thus the wave low day belongs to the down wave and is also the begin day of the up wave.
We hope this doesn’t make your head hurt.
| Start Date | End Date | Start | End | Points | % | Days up | Days Down | Drift+Flush |
| 3/6/09 | 5/8/09 | 6469.95 | 8587.54 | 2117.59 | 32.73% | 45 | ||
| 5/8/09 | 5/21/09 | 8587.54 | 8221 | -366.54 | -4.27% | 9 | 13 | |
| 5/21/09 | 6/11/09 | 8221 | 8877.92 | 656.92 | 7.99% | 15 | ||
| 3/6/09 | 6/11/09 | 6469.95 | 8877.92 | 2407.97 | 37.22% | 68 | ||
| 6/11/09 | 7/8/09 | 8877.92 | 8087.18 | -790.74 | -8.91% | 19 | 23 | |
| 3/6/09 | 9/23/09 | 6469.95 | 9917.99 | 3448.04 | 53.29% | |||
| 7/8/09 | 8087.18 | |||||||
| 7/8/09 | 8/7/09 | 8087.18 | 9437.71 | 1350.53 | 16.70% | 23 | ||
| 8/7/09 | 9437.71 | |||||||
| 8/7/09 | 8/17/09 | 9437.71 | 9116.59 | -321.12 | -3.40% | 6 | 10 | |
| 8/17/09 | 8/28/09 | 9116.59 | 9630.2 | 513.61 | 5.63% | 10 | ||
| 8/28/09 | 9/3/09 | 9630.2 | 9252.92 | -377.28 | -3.92% | 5 | 9 | |
| 9/3/09 | 9/23/09 | 9252.92 | 9917.99 | 665.07 | 7.19% | 14 | ||
| 9/23/09 | 10/2/09 | 9917.99 | 9430.08 | -487.91 | -4.92% | 8 | 11 | |
| 10/2/09 | 10/19/09 | 9430.08 | 10117.98 | 687.9 | 7.29% | 12 | ||
| 10/19/09 | 11/2/09 | 10117.98 | 9678.95 | -439.03 | -4.34% | 11 | 11 | |
| 11/2/09 | 11/17/09 | 9678.95 | 10419.88 | 740.93 | 7.66% | 12 |

