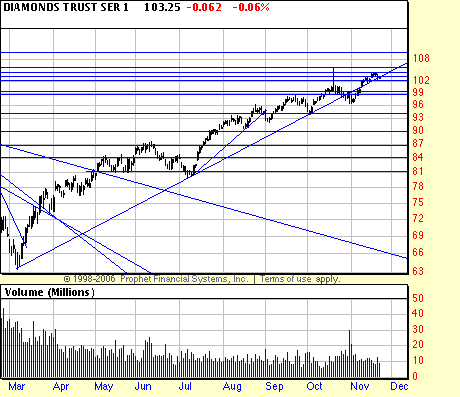
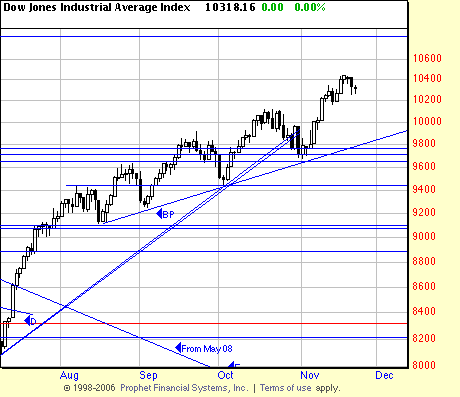
 We are now in the drift part of the pattern after a surprising one day surge at the top. This is better illustrated in the chart below. At the moment there is no sign of the bear wave traders have been hoping for and fearing ever since March 9. Illustrating once more that it is better to read the chart than it is to read the news.
Readers will notice some additions to the table below, namely we have calculated the distance from wave high to wave high. Well, we had to be doing something — we don’t spend all our time examining skirt lengths and consulting astrological tables. The high to high calculation gives us some idea of the “speed” of the market. Not too fast, not too slow. Just right for Goldilocks.
Nonetheless we are hyper alert watching for the first sign of an attack by Goldiman and the three bears.
Although we did drop in on the Hard Assets Conference in San Francisco this weekend. What was hard to believe (speaking of skirt lengths) was the bevy of babes (displaying a full bull market of buxom flesh) Jim Dines had running interference for his booth. Someone asked us what he was selling and we diplomatically replied “sizzle”.
Dines is of course justly famed for his letter (and also for his babes as I heard at the conference). He proclaims himself the original gold bug and the original rare earth bug.
No entymologist, we, as Henry B. Luce would say.
 Although the volume was a bit exaggerated on the next to last bar it didn’t seem to qualify as a climax day.
| Start Date | End Date | Start | End | Points | % | Days up | Days Down | Drift+Flush | % up | % down | High to high |
| 3/6/09 | 5/8/09 | 6469.95 | 8587.54 | 2117.59 | 32.73% | 45 | 32.73% | ||||
| 5/8/09 | 5/21/09 | 8587.54 | 8221 | -366.54 | -4.27% | 9 | 13 | -4.27% | |||
| 5/21/09 | 6/11/09 | 8221 | 8877.92 | 656.92 | 7.99% | 15 | 7.99% | 3.38% | |||
| 6/11/09 | 7/8/09 | 8877.92 | 8087.18 | -790.74 | -8.91% | 19 | 23 | -8.91% | |||
| 7/8/09 | 8/7/09 | 8087.18 | 9437.71 | 1350.53 | 16.70% | 23 | 16.70% | 6.31% | |||
| 8/7/09 | 8/17/09 | 9437.71 | 9116.59 | -321.12 | -3.40% | 6 | 10 | -3.40% | |||
| 8/17/09 | 8/28/09 | 9116.59 | 9630.2 | 513.61 | 5.63% | 10 | 5.63% | 2.04% | |||
| 8/28/09 | 9/3/09 | 9630.2 | 9252.92 | -377.28 | -3.92% | 5 | 9 | -3.92% | |||
| 9/3/09 | 9/23/09 | 9252.92 | 9917.99 | 665.07 | 7.19% | 14 | 7.19% | 2.99% | |||
| 9/23/09 | 10/2/09 | 9917.99 | 9430.08 | -487.91 | -4.92% | 8 | 11 | -4.92% | |||
| 10/2/09 | 10/19/09 | 9430.08 | 10117.98 | 687.9 | 7.29% | 12 | 7.29% | 2.02% | |||
| 10/19/09 | 11/2/09 | 10117.98 | 9678.95 | -439.03 | -4.34% | 11 | 11 | -4.34% | |||
| 11/2/09 | 11/17/09 | 9678.95 | 10438.16 | 759.21 | 7.84% | 12 | 7.84% | 3.16% | |||
| 11/17/09 | 10438.16 | 10271.67 | -166.49 | -1.60% | 4 | -1.60% |

