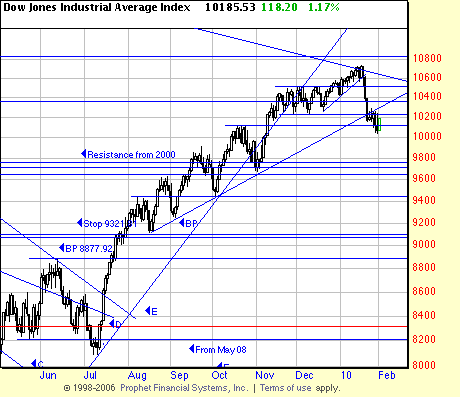
 Negative indications (as previously pointed out): The downtrend line at the very top, the broken long term uptrend line from March, the very length of the uptrend from March, the false breakout from the rectangle, the piercing of the support line at the bottom of the rectangle, the possible interpretation of the present pattern as a flag, the violence of the present downwave… All these elements would seem to argue for a continued downwave.
Positively, the uptrend line from August and the support line from October should offer support to the market and in fact the market rallied today off the horizontal line.
Could you get a headache from this, trying to figure out what comes next? Yes.
There is another way to look at this situation, that is, with a Basing Point analysis. We pointed out previously that if the formation is a flag pole with flag that the measuring implications were a target of (m/l) (more or less) 9700. Now the interesting aspirin is this: If you take as the Basing Point the rectangle low of 1/27/10, 10231, and insert a 5% filter the stop is 9719. Interesting.
We have, on occasion in the past, perhaps, serendipitously, fostered tranquility in our students by pointing out that waves go up and waves go down and that if you observe a rational long term control procedure, like StairStops, you will master the market. You will lose some paper profits at the top on the last wave. That is the price you pay for tranquility.
It’s probably worth it.

