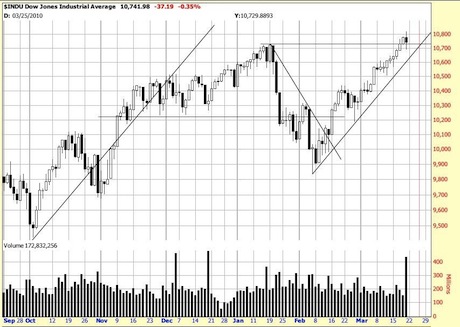
 As we were saying in our last letter, time for a downwave. but what is it about this chart that draws the eye?
The volume is climactic. Like an exclamation point. That’s it folks!!.
Smart (and impatient and restless) technicians and traders have been talking for a week or so about selling new highs, and they did so Friday. That and profit taking after 8 days up (an almost certain play for a downside bet) combined to produce the volume bar.
But like 99% of the phenomena in the market the meaning is not crystal clear. Back in December there were several days of extreme volume — sturm und drang signifying nothing. The present bar is not a clear power bar. That would be a long black bar finishing on the low.
So what do you do? Magee systems investors will watch with interest as contrarians gnash at each other. It’s just a downwave, after all. Traders who need action could sell calls, buy puts or go short. For our own account, at the moment we will be watching for the downwave to exhaust itself and then adding on to our positions. Investors should be aware that we might see a retracement to 10400.
The purpose of this is to force selling by unworthy and unwashed investors who can be relieved of their positions by sharp downside waves.
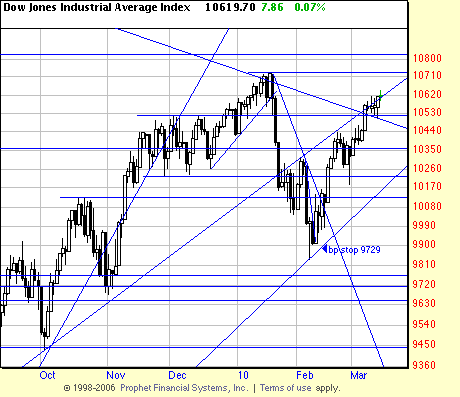
On the other hand if they get it down to our stop we will congratulate them on being serious and hand over or hedge our positions. The stop is show below. It is always instructive to look back (March 12th in this case) to see where we have come from.
 This sharp upwave has offered us no higher Basing Point and stop than that illustrated here.

