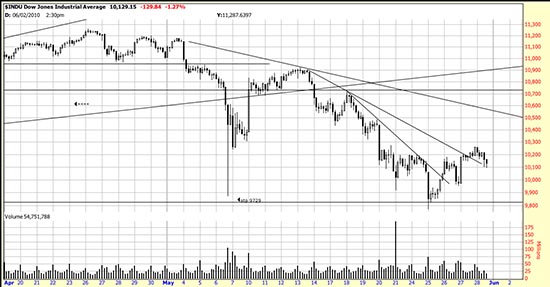
 Ordinarily we let the markets do what they want to do on the hourly basis. And the markets do what they want to to us on an hourly basis. And there are times when we look at the hourly charts to see what the foretell (if that is possible) on a daily basis. On this hourly chart we can see broken downtrend lines and the arresting of the downtrend. In fact you might even see a kilroy (or H&S) bottom forming here. The exaggerated volume on the 23rd looks like a volume climax. Old traders, like ourselves, get itchy in times like these and try to beat the market by trading, instead of trending. Many bleaching skeletons lie on the deserts of past markets of dead traders. We’ve left a bone or two in those deserts ourselves. That’s why we constantly encourage our readers to remain above the day to day naked mud wrestling.
Usually our analysis takes us less time than shaving. When volatility reaches its present levels it takes more time than running a marathon — maybe because that’s what we’re doing, running a marathon.
After considerable study we have the following long term comments.
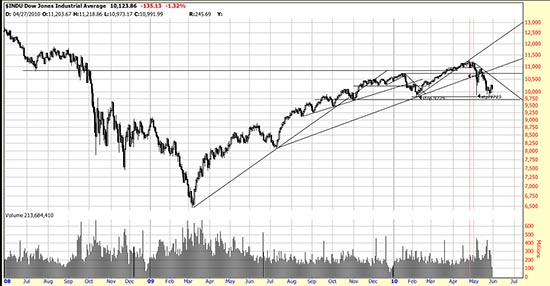
 Here is two years of the Dow. Two events occurred in May (if not more). Prices ran headlong into long term resistance (look at the horizontal line going back to September ’08) and penetrated the February trendline. After that it couldn’t do anything right, and broke the important July (’09) trendline. This resulted in wholesale (and retail) panic and the present sell off ensued.
While downwaves of this violence are unpleasant the present reshuflling of the musical chairs has not yet signaled a major market trend change. Contrarians and bears (and Goldman) are doing their best to take out the February low in order to shear the lambs and prepare the ground for a new wave up. Other traders and contrarians are seizing the lows to establish positions. Magee traders are holding their longs and waiting to see who will win. As is obvious from the chart a bull market is in train from March of ’09.
Now for some fearless predicting. Remember, if it’s wrong you didn’t hear it here. You read it on one of blabbering talking heads on Fox (as in dumb as) or CNBC. On the other hand…..
Look back to November of ’09 and observe where it falls in the scheme of things. It falls pretty close to the Basing Point calculated stop presently in force. Look at how that line describes everything that has happened since November. It is entirely possible (if not likely) that it will continue to describe what happens here for some months. (Assuming that the stop is not taken out, causing a Niagara Falls panic.) This would result in a trading range from about 9700 to 11250.
This will result in swings in equity for trenders. For traders buying at the low of the range and selling at the top (of course you will have no trouble identifying those levels –yes, yes, we’re joking) is the tactic. Trenders who accept what is may be sickened from time to time but sooner or later the rocket will take off and patience will be rewarded. Isn’t that what happened in G&S’s Patience?

