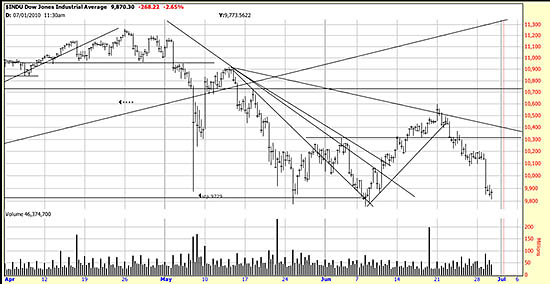
 The market is certainly spooked. Could have something to do with the full moon. Or fear of Greeks selling bearer bonds. Whatever it is it’s like a roadside bomb. In looking for bottoms on a short term basis we can go to hourly data to look for hints of the possible future direction. What we see in the hourly chart of the Dow looks like a bottom forming, and even has a breakout across significant trendlines. But then it turns and returns to the congestion pattern.
Here is a fact from the analyst’s tool kit. A false breakout is often a good signal to take the trade in the opposite direction. The market is obviously on the razor’s edge here, and not that far from our Dow stop of 9729 (close only). It is at the absolutely critical support area of the previous lows. It is essential that traders and (yes) investors too be prepared to either exit the long side of the market, or hedge their positions, or go net short.
Investors hate these decisions. You can overcome your distaste by recalling what happened from January 08 when we went short to March 09 when the market bottomed.
And of course mixed signals abound. Tesla goes public with a bang. The S&P took out its bottom. There is no new information in the market (unless somebody forgot to tell us). One wonders if the market is trying to tell world governments that now is not the time to start worrying about deficits. In fact the G-20 meeting is profoundly disturbing from an economist’s point of view. This great recession can turn into another great depression unless stimulative policies are continued. Remember you heard it here first (well Paul Krugman has been agreeing with us…).
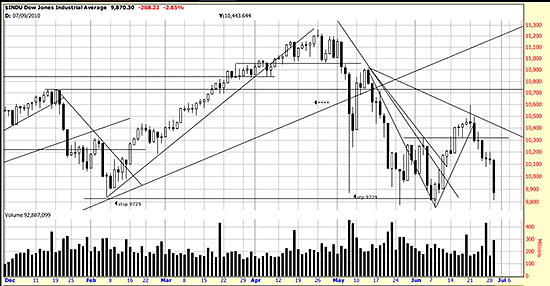
 At the same time the reader can see in the daily chart a pattern of lower highs and lower lows being set up. Taking out the June low would create very negative conditions.
We will be evaluating conditions and weighing whether to scale in to shorts or to go in bigger at the beginning of a short trend.

