http://stockcharts.com/h-sc/ui?s=$UST&p=D&b=5&g=0&id=p30923843948&a=205377734
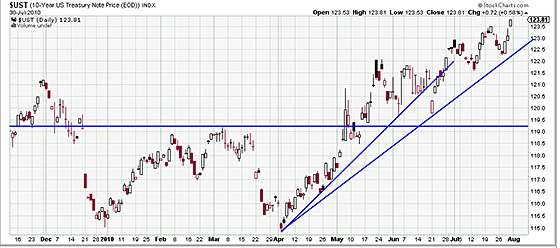
We conjectured, just a letter ago that there might be a double top in the bond ETF (TLT). This chart ought to put paid to that notion. The bond market may be about to go parabolic. (Read, BUBBLE.) Here it’s making a new high in the 10 years. If you’re in it great. If not stand aside lest you get splattered with the inevitable bloodshed.
Sometime later this weekend we will post a letter we are presently preparing on all the flations. Be certain to read it, as the markets are in a greater state of uncertainty than they have been in for 5 years.
We are still struggling with presenting the new charts. Ever since they took away our engineer’s card we have struggled with all this new fangled technology. Maybe we should go back to hand drawn charts. Or maybe we should hire some smart high school kid.


