http://stockcharts.com/h-sc/ui?s=$INDU&p=D&yr=1&mn=0&dy=0&id=p03149889863&a=204730441
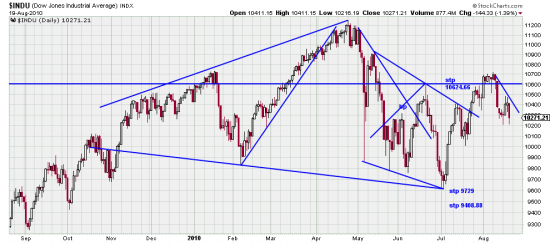
It appears that dumpity bump pattern may be setting up. (sell off, thrust up, sell off) At the least we can now draw a downtrend line from the high 9 days ago. We estimated that this downwave would be about 5 days — it was 6 before a three day upwave furnished us with the point for a trendline. This chart shows a tentative analysis of a broadening pattern we have pointed out before. Note that there is an uptrend since July 1, and this may just be a downwave of that pattern.
On the possibility (if not probability) that the buy signal the 2nd August was a bull trap we sold our longs in the Qs, the DIA and SPY — these were light anyway as we would have been scaling in after the buy signal.
If — and when — and if the conditions are favorable, we would make a light trade when this latest trendline is broken on strength to the upside.
This market is a fragile as Cinderella’s slippers. An unkind word will break it.


