http://stockcharts.com/h-sc/ui?s=$INDU&p=D&yr=1&mn=0&dy=0&id=p03149889863&a=204730441
Sometimes the lexicon is strained to describe the market. While this is technically a mule (or sideways) market, mule hardly describes it. In the past we have made significant contributions to the nomenclature — Kilroy (H&S) Bottoms, bungee markets, squirrel markets, dumpity bumpety patterns– (we understand that these contributions have been eagerly adopted in Roumania and Kazakstan).
Casting about for a description that fit the present market we found the old state fair metaphor — the greased pig. (In the old bucolic days at the state fair one event was the loosing of a greased pig to be chased by the jolly rustics. He who succeeded in capturing the pig won the prize — usually a side of bacon. Later this innocent pastime was memorialized in the establishment of the pork belly market — but we digress…
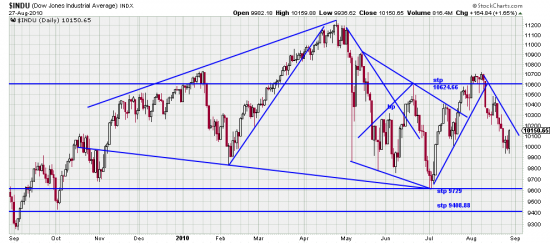
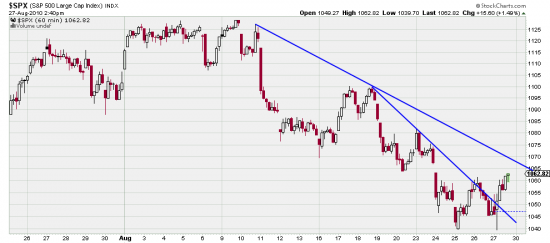
Greased pig fits. Since April 26 there have been 14 changes of direction. You could easily get whiplash. The present downwave has seen 6 days down, 2 up, 5 down and 2 up. Whether the wave has ended will not be known till later. Generally we want to see three days away from the low day to confirm its importance. For our own account we bought the S&P with the breaking of the hourly downtrend by a power bar which also looks like a reversal bar.
http://stockcharts.com/h-sc/ui?s=$SPX&p=60&b=5&g=0&id=p56355318193&a=207271686
We will liquidate this trade if the nearby low is taken out or when an uptrend line (not presently existing) is broken.
Frankly we think our readers are better off in dividend stocks. And we would be too, but what ya gonna do in a sideways market?
The top chart perfectly expresses the state of the markets right now. There is a broadening pattern, small and large and — in our opinion the most important — a sideways pattern. This last is, pure and simple, the dominant factor in the market. When prices exit from the mule (pig?) market we will expect to find a profitable trending market.


