http://stockcharts.com/h-sc/ui?s=SLV&p=D&yr=0&mn=6&dy=0&id=p59476852126&a=203282121
A few days ago we tried to play smarty pants with gold and silver by selling our position as it neared the resistance of the high. We said at the time that it was not the right thing to do for our readers who should be trend following. Sure enough we had to reestablish our position as they made new highs. This is only the 3,001st time we have learned this lesson. As they say a smart man learns from his mistakes. A wise man learns from the mistakes of others. Evidently we don’t fit either category, but we have the position and took nice profits and only missed a little piece of the move there. And we learned our lesson (3,002).
Of course it is only a matter of time till they hammer these markets with painful down days.
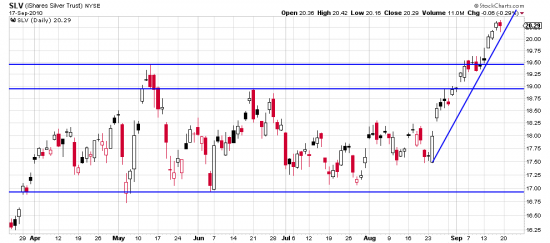
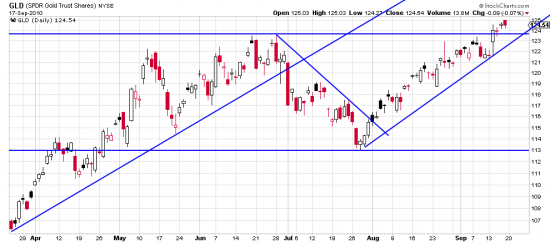
Silver is in an 18 day wave that is 16.8% long. Gold is in a 36 day wave that is 10.5% long.
http://stockcharts.com/h-sc/ui?s=GLD&p=D&yr=0&mn=6&dy=0&id=p23550335056&a=203282120
We have been tending to look at the gold as a trading range market, but after reexamining this chart we see that there are clearly defined waves here, and we are in the next (or current) upwave. As the night doth follow the day the downwave doth follow the upwave. Regrettably the basing point is under the low of July. The truly patient and mature investor would look at any downwave which did not taake out a stop 2-3% under that as a passing annoyance. You could also use the low of the 17th, 124.27 as the basing point and put the stop 5% under that. Same with silver, except the long term basing point is on the 8/24 low.
These are the rewards of long term trend following and patience. Dear reader learn them without having to suffer 3,001 (2?) lessons. And remember, do as we say not as we do.


Guess I’m confused as to why the low of the 24th is a basing point in GLD. I reread chapter 28, but still don’t see the answer.