http://stockcharts.com/h-sc/ui?s=$INDU&p=D&yr=2&mn=0&dy=0&id=p29426735132&a=205639989
In general we evaluate the market through the lense of the Dow. And in general this is effective. Occasionally there is a divergence between the three major indices (Dow, S&P, Qs). But a buy or sell signal in the Dow we generally take as a marketwide signal, and the same with sell signals.
So let us review briefly where the stops are now.
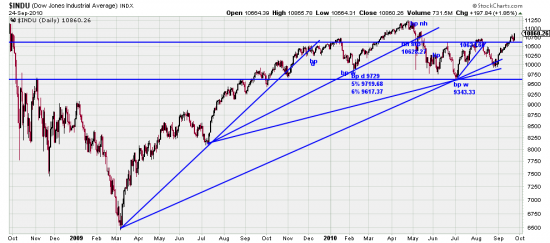
Back in August (2) we saw a buy signal in the Dow, derived from a Basing Points analysis. The stop then based on the 7/20 low of 10236.40 was 9724.58. That is still the stop for Basing Points. We can see alternatives to this considering recent price behavior. We could see a reasonable stop based on the 9/20 low of 10608.08 at 10077.67.
Mule markets, sidewaves, trading ranges are notoriously difficult and often a simple trendline analysis is better. We have seen a number of false signals since April — both for ourselves and for Dow Theory. And, while we have exited from one trading range there is no assurance whatsoever that the sidewave is over — not until the April high is taken out. Also we think that market participants are jumpier than frogs who fear being turned into frog’s legs.
Meantime we scoff at the double dippers who have been baying at the “head and shoulders” top but that doesn’t mean we are not analyzing the chart for every possible scenario. And in fact as is clearly seen on the chart there is a 10 month sidewave. When this market breaks out it is going somewhere serious. So what some may see as a top may well be a consolidation. No one knows yet.
We will be evaluating strategies with all vigor over the next few weeks — having watched many markets eat the pumpkin for Halloween.


