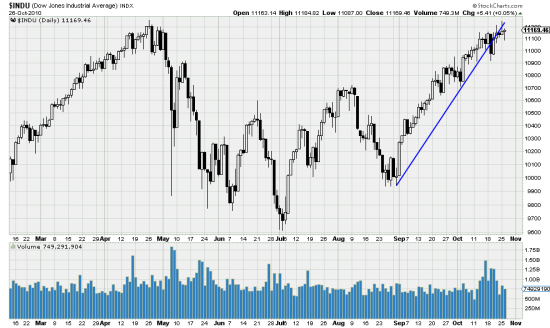
Here is what is interesting about this chart. The rate of change, or speed , of this chart is arresting. In 10 days, from close to close the Dow has changed 73.38 points and .66%.
In 43 days the Dow has changed 901.38 points, or 13.20%.
What does this tell you? What it tells us is that there is very possibly hell to pay.
When the index hesitates like this it is getting ready to raise hell.
What can you do about it? You can go hedged. You can buy straddles. (Please don’t ask. It’s a sophisticated strategy. Ask your broker.) You can wait with bated breath. (Note, bated, not baited. What a pedant.) (In defense of pedantry, if it weren’t for pedantry people would go around misspelling words and creating linguistic anarchy and neologisms, than which there is nothing worse.) Or you can do the mature trend following thing and observe your stops and not sweat this downwave because dollars to doughnuts (krispy kreme KKD 5.94) this market is going up, not down. A long way.


