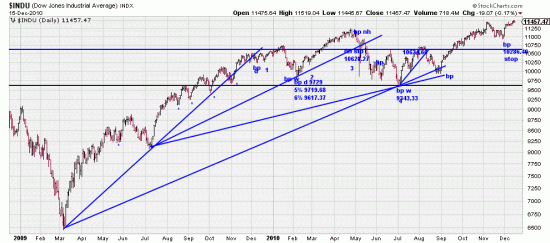
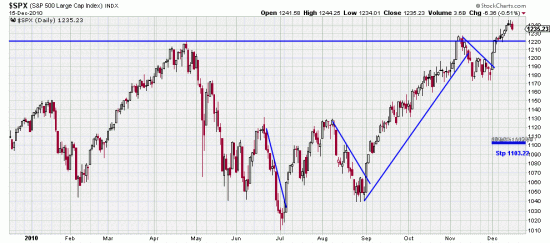
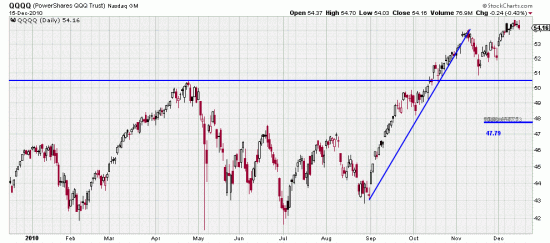
 Illustrated the progressive stairstops in the DOW to the present with the latest stop noted. 10286.40. Calculated from the 11/30 Basing Point at 6%. While we think this a reasonable protection the real indication of a major change of trend is the stop we have talked about for months, that is below this entire sidewave particularly the weekly stop at 9343.xx. But the other stops are certainly valid and good. We like the SPX stops a little better, just because of the chart pattern:
 This requires price to penetrate the support of the sidewave congestion and is a very solid technical stop. 1173.64. These stops are indicative for the entire market. If prices should penetrate these levels individual stock positions would have to have very strong charts to avoid liquidation (always a possibility).
 Looking at these charts there can be little doubt that we are looking a potentially momentous moves. The Qs stop is 47.79.
We think at present that the likelihood of these stops being tripped is quite low, but that is what unfortunate Enron investors thought before they went broke. And Jimmy Cayne’s last words before losing a billion dollars in Bear Stearns were: Never sell the company stock.
Now a word about killing the fatted calf. We just added on to our positions in Qs and SPX. You shouldn’t do this right now. Our timing was not felicitous, as a down wave is just beginning. But in general you want to build your positions as the trend progresses. Next add-on should be when this downwave ends. At the moment we are not expecting more than a minor wavelet.


Hi
how about an expanding correction, i.e. SPX to 1150ties hurting all bulls and then running up into a new high. Base of this thinking is the sub-structure of the 28/11 up move.
Alain
The SPX CHART needs a correction. Please add bp line with value, 5% stop and 6% stops with value. It appears the Bp line is drawn at 1220.. No bp line for 1173.64.
These charts aren’t readable unless you use Stockcharts
Thank You,
Tom