 http://stockcharts.com/h-sc/ui?s=$INDU&p=D&yr=8&mn=0&dy=0&id=p70025472730&a=214738592
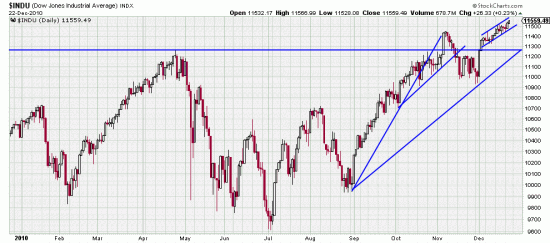
To make any sort of sense, short or long range you have to look at the yearly chart of the Dow. And even, extracting sense from that requires more than a little headscratching. Basically a sideways market for a year. With a very nasty 4 month downwave. We said at the time that choppy vicious markets like that are necessary to send the faint of heart to CDs and Bonds. Preceding the bloodletting there was a 54 day (14.47%) upwave. The subsequent downwave and sidewaves were rarely longer than 10 days and less than 8% in general. Finally August 27 we started an upwave of 51 days and 15.25%. There followed a 16 day downwave and then we began the present 18 day upwave (5.83%). Through it all the wisdom of long term stops has been demonstrated. (Though sometimes painful.)
In November a breakout of the yearlong pattern occurred, but was a momentary bull trap. But the present upwave would appear to be definitive breakout. Do not rejoice yet. This 18 day upwave can also be characterized as “upward drift”, or “slope”. These formations have some bearish implications. But we have been saying for a couple of weeks that there are some bear signs in the wind — the VIX shrinking particularly as well as the range contraction which has been going on for a couple of weeks. Nonetheless we see all this as major bullish. We think that while the unwashed and unworthy shrink on the sidelines that we will be killing the fatted calf and eating and drinking and making merry in the new year.
So enjoy Christmas because when the real traders get back from Aspen and the Hamptons there should be some shooting. At the moment we don’t think it will be serious, but being prepared mentally always helps weather it.

