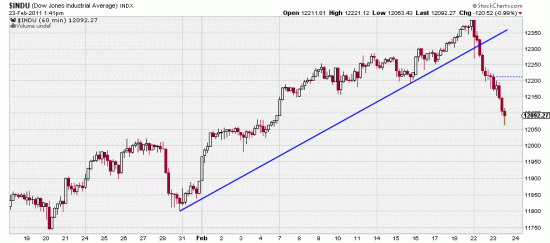
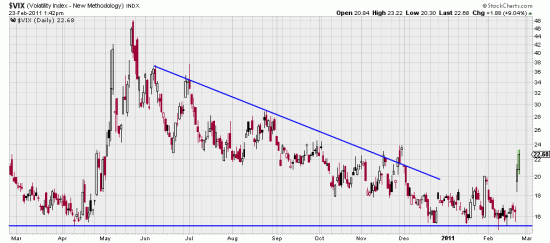
 This is not quite as extreme as it seems. It’s an hourly chart, but it dramatizes the last two trading days. Extreme power bars — daily moves of more than 1%. Those look like trading signals to us. Remember, trading signals, not investing or trend following signals. Don’t come with crocodile tears if you change your method back and forth based on a day or so’s action. And remember. Trenders win. While traders kill each other to get the last chair when the music stops, trenders watch with amusement and scorn.
The last downwave lasted 15 days and took back 4.56%. That may have as much to do with what’s going to happen as the fact that today is Wednesday, and in two more days it will be Friday. Thank Allah.
Meanwhile at the end of last week we were saying that an occasional trade made on whim could be beneficial. Well, here it is, a few easy bucks in the VXX while Libya burns.
 Power bars like this can often lead to the dreaded downwave, so we will be hedging some index positions today. Meantime our gold, silver and euro positions are alleviating the pain.
Also about waves: Back in 2005 we were telling our graduate students that the real estate crash was coming. It doesn’t take a lot of brains to look at a parabolic wave and short it. Looking at the Case-Shiller wave and listening to our friend Bob Prechter was enough for us. Now a word to the wise about moving in to buy discounted real estate. Whether you believe in Elliott Wave Theory or not, one thing is true about it — the ABC wave. That is the first plunge in the market is the A wave, the second wave is a partial recovery, the B wave (as smart operators flock in to buy “cheap” issues). The third wave is a further plunge — the C wave as the smart operators watch their cheap issues get even cheaper. Readers may recognize this as our, dump-bump-dump pattern. The sharp operators are buying when there is blood in the street. Sometimes their blood gets added to the pool. Remember — you don’t buy till it starts going up again.

