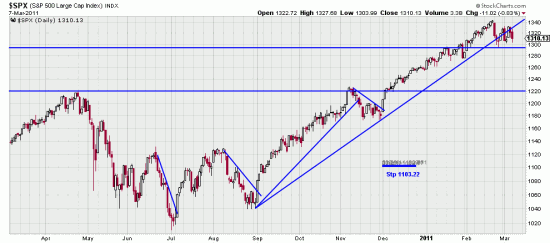
 This little downwave looks a lot like the downwave we saw in November. That one lasted 16 days and took back 4% +. This one has lasted 10 days so far and (on the Dow) is down 2.82%. The pattern is of course the same in all the indices. The punditry is flapping its wings (like Chicken Little) and saying, Do we have a bubble. No. What we have is a need for the punditry and the media to get attention and create eyeballs.
On the other hand let’s take a look at SLV.
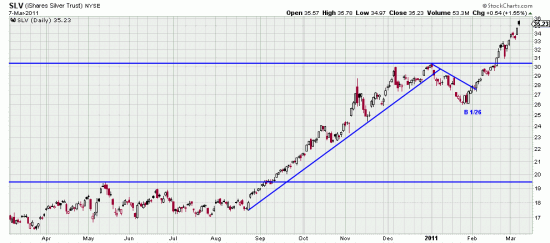
 You can see silver here looking like it’s going parabolic. Naturally parabolic curves fall over on their side. Silver has an interesting rhythm. The previous upwave here was 20 weeks long. The sidewave which preceded that wave was 23 weeks long. The present wave, which may be the high tide for the moment, is 29 days and 37.46%. Is this the end? No. Might we see a radical downwave? Yes. Will it change the major trend up? No. Might it smart? Yes. But even long term trend traders should have a stop. If you get stopped out you can always get back in. For the trender here the truly tranquil investor has his stop under the Basing Point of 1/25. You could also use the low of today, the 7th as a Basing Point. Traders who don’t want to sit through the downwave are as always on the horns of the dilemma (or bull). You could exit on a strong up day (be sure to do this at the top of the day). Or you could place a tight stop a few decimals under the low the day and raise it every day. You could even watch the hourly bars and bail out on a trend line break. These same comments pertain to GLD.
We will recognize you when we see you. Yon Cassius hath a lean and hungry look. (Traders) Let me have men about me that are fat; Sleek-headed men and such as sleep o’ nights. (Investors)

