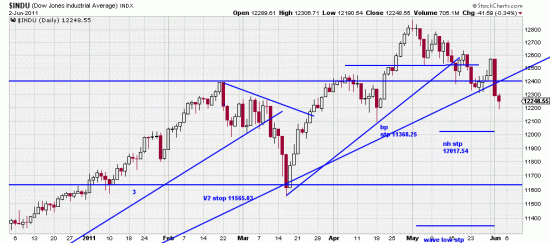
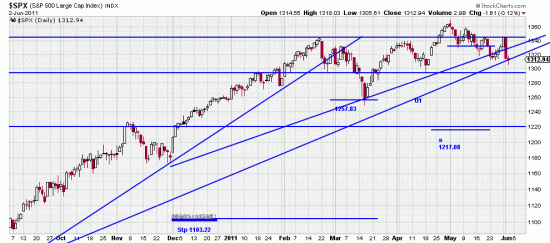
 The trendline from March 09 is broken. As we have said repeatedly, trendline breaks always have consequences. Some of the minor trendlines were already broken (obviously — and the harbingers of this break). While the Basing Point stops have not been hit it never hurts to do some hedging, or even some scaling out. How big a downwave — or sidewave– results here remains to be seen, but waves are often proportional. There are of course those who compute fibonacci retracements and those who shake the old crystal ball. We are still long gold and silver and the Swiss franc, but we sold the Ford in one of the kids’ accounts today for about a handsome profit, as it was bought as a lottery ticket in the great crash.
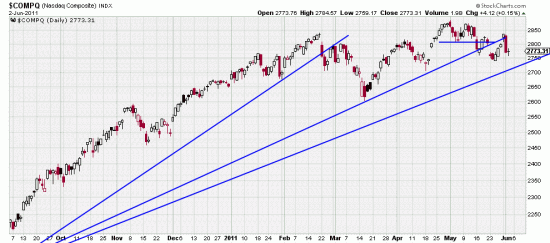
In the 9th edition of TAST we advanced an idea we called “Composite Market Theory” — that the state of the market needed the harmonic action of the Dow, the S&P and the COMPQ.
 As you can see the March 09 trendline is pierced here also, though not as strongly.
 The Q has not broken its trendline yet so you might say that there is one of those famous divergences here, but the break appears imminent.
The formations definitely have a toppy or sideways character. To nullify this nasty looking situation prices would have to make new highs, and as they appear to be heading in the other direction that is probably not going to happen. In situations such as these it is wise to abandon trend tactics and either trade, short, or stand aside.


Should one be using log charts for the long term trendline? On a simple chart the Dow is still a ways above the trendline from March 09. I have noticed that most tech analyst use the simple not log trendline and therefore conclude the bull market is still in good shape?
log charts are best I think. earlier warnings. and if you tried to use arith charts you wouldn’t have a piece of paper big enough for today’s markets.