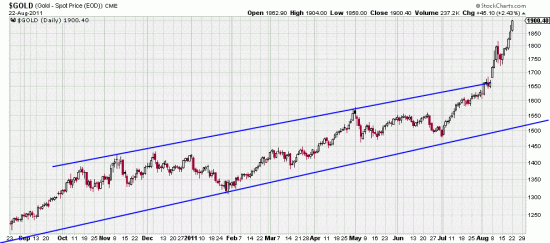
 The markets are unfolding as we foresaw in our last letter. Occasionally we keep our mouths shut in order not to spoil the illusion of infallibility, also, when there is nothing more to say, why say it. The Beta wave was turned back as we expected and the C wave is now in operation. (Illustrated in our last letter.) Meanwhile traders piled into gold and silver. Here a long term gold chart showing the danger of what is going on — gold poking its head up above the long term channel and quite possibly going parabolic, which will quite possibly end with traders getting parboiled.
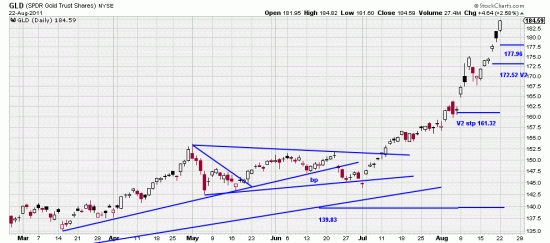
Also, when you look at it up close you can see that the last 15 or 16 days look like a flag. The target of this flag is 184.27. Oops. Closed today at 184.59. Flags do not necessarily end waves — especially in the present environment, but it pays to be carefully stopped up.
Several possibilities are illustrated on this chart:
 http://stockcharts.com/h-sc/ui?s=GLD&p=D&yr=0&mn=6&dy=0&id=p25530259881&a=234983962
The higher stop is a trading stop: 177.96. The lower stop is the V2 trend stop: 172.52. Even this may be too close for the volatility of these markets.
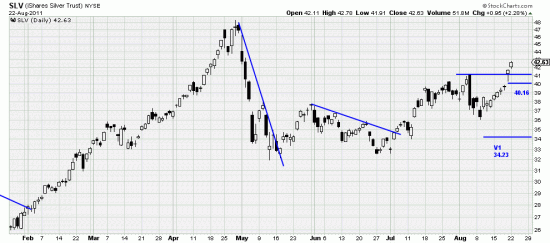
Silver which is also breaking away is less developed than gold. It has broken out and is buyable but with great caution and alertness.
 http://stockcharts.com/h-sc/ui?s=GLD&p=D&yr=0&mn=6&dy=0&id=p25530259881&a=234983962
The prudent trend stop here is 34.23. the trading stop which will get you ejected from the market, spoil your day and make you eat your heart out is 40.16.
We are long both and wondering why we are long a flag at this point. Youthful enthusiasm probably. Or youthful rashness. We could get short the gold in a New York minute — which as everyone knows contains only 58 seconds.

