This letter was posted on the edwards-magee googlegroup. Is reposted here in the event that all readers do not subscribe (which they should http://www.groups.google.com/group/edwards-magee)
The best place to ask a question is in the edwards-magee google group in response to a reader question. (We are always eager to answer reader questions when we are aware of them.) Because of the particular way that we see the site when we write letters we tend not to notice comments posted on the site.
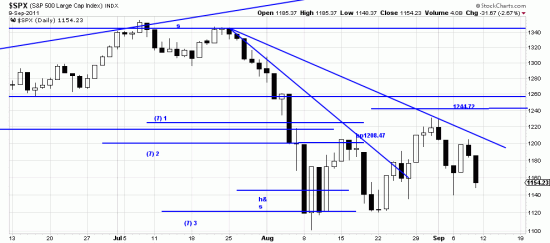
The bp and stop are illustrated on the spx chart (attached) the bp is 8/17 with a filter of 3%. This is a SHORT bp, as according to the bp system long term traders should be short.

in a falling market wave highs become bps for the short trade. Research has shown that over the long term a 3% filter seems to produce the best results, but it is a pretty tight stop. In fact we are thinking about revising it upwards because of market volatility over the recent past. Readers can do this on their own by computing a 4 or 5 % stop from the Basing Point. We will call attention if analysis and prudence seem to demand it. We are concerned about getting whipsawed here.
We never labor to catagorize formations and advise against it. But the reason we think this is a “congestion phase” or continuation, or reversal lies partly in its proportion to the supposed flagpole. It looks too big and unruly to be a flag, which we usually find to be pretty obvious. But it is not necessary to catagorize this formation in order to trade it. First of all long term traders should not be trading here at all. Second horizontal lines drawn at top and bottom of this formation are the signal lines. –when broken the signal appears. If this were a flag it would lead one to increase shorts and there is no indication of which way the price will break. A flag flaunts the message that another surge in the original direction will appear.
My ebook Signals has a number of flags in it and discussions of them.
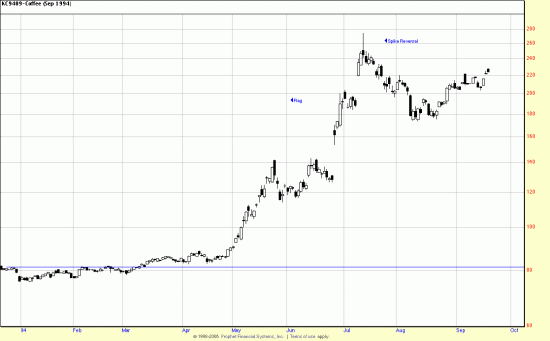
 Here is a classic case. The rewards for recognizing this formation are excessive. But it starts with the recognition of the first signal, which is the extravagant gap in June, and entering the position. Flag recognition comes early in July, confirmed by the next extravagant gap. The spike reversal ends the trade — and note, this is a trade, not an investment. If you saw this coming in one of your stocks or commodities you would in most cases be justified in suspecting the end of the trend.
In the bush crash TLT showed a flag like this which was very profitable to recognize as we shorted the end of the flag with TBT. These are engraved invitations from the market to sweep up easy money.


‘beta’ correction before ‘gamma’?
Alain