Is there something shameful about talking about bank stocks? Or do you just get enraged when contemplating the obscenities of sub-prime loans, manipulation of minorities into unfavorable loan conditions, or robo signers? Or do you just get high blood pressure contemplating what they did to the country and the economy? Besides that we’re still personally mad at the sharpsters in Charlotte who outsmarted Bank of America executives and moved our bank to Hicksville. (No offense meant to Charlotte.) (We moved our important accounts to Wells-Fargo the next day.) Then they compounded the offense by buying Countrywide and then Merrill Lynch and who knows what else in an orgy of hubris and narcissism. Excuse us while we take our high blood pressure pill –as we were saying, feelthy stocks?
That feels better. Now we can talk about these obscenities as investment vehicles.
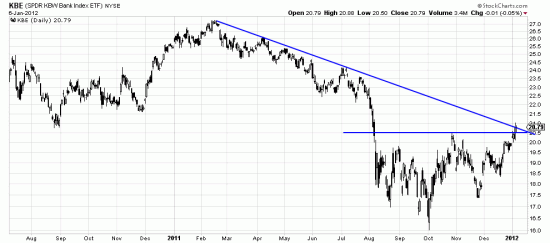
 KBE the bank index ETF is as you can see in an interesting situation. A bottom has been formed since August — don’t worry about what to call it. A clear neckline is being broken. And, serendipitously, the long term trendline is intersecting with the neckline breakout point. Strong technical stuff.
We consider this a long term trend trade. The best Basing Point is on 12/19 at 18.34 but a more aggressive one is 12.28 at 19.52. We think wide stops are necessary for the banks as it may be a hairy ride, but you may be subtly bragging about the trade in a year or so.
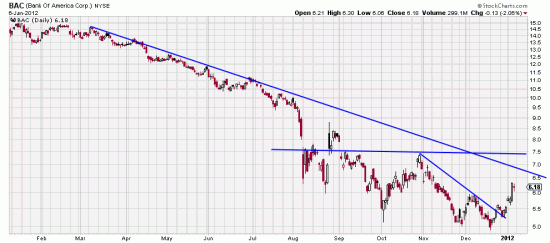
 The bottom may be less well formed in BAC and there is an aggressive trade (long term entry) at present on the breaking of the short term downtrend line. More conservative investors may wait for the breaking of the long term trendline and/or the breaking of the neckline. In cases like this we like to remind readers that is better to be partly right than being a genius –that is, scale into the trade in 3 to 5 tranches as the trend progresses.
The 12/19 Basing Point is 4.92 and the 12/28 is 5.27. The filter is a minimum of 5% in both cases. Ultra conservative 6%.
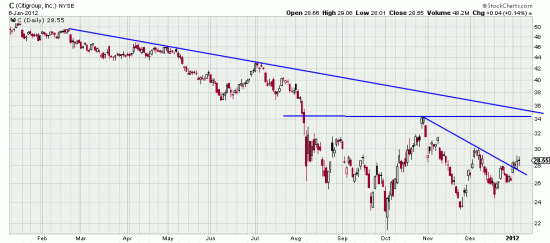
 C is buyable only for aggressive traders at this point. There is a clear bottom but it needs to break the neckline. It is charts like this that are supporting the strong KBE chart.
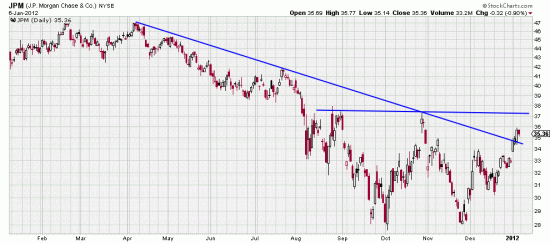
 JPM has an even stronger bottom pattern. Apparently a double bottom with prices accelerating to the neckline. The December low is the Basing Point. The long term trendline is being broken even as Tim Tebow is praying for divine help this weekend. With charts like these the banking business may not need divine aid.
We could use some divine help from the Saints — like by losing so the Niners don’t have to face down Drew Brees next weekend. There will be lot of San Franciscans on their knees about that.

