http://stockcharts.com/h-sc/ui?s=$SPX&p=D&yr=0&mn=6&dy=0&id=p40392582161&a=254727527
You can use this link to see a larger chart.
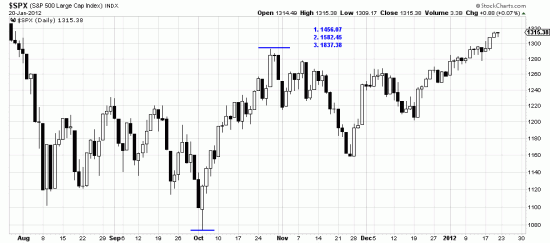
We haven’t stopped detesting forecasting, but there is a question in the waves here that should at least be mentioned. Our last comment on potential for this trend, using the Wyckoff measuring method, forecast a wave high of 1860. While this seems fanciful to us, there is another method we have talked about before — the rule of seven.
Computing the length of the first wave with the rule of seven factors we get the wave high targets illustrated here: 1. 1456.07, 2. 1582.45, 3. 1837.38.
What are the probabilities? We don’t even want to compute them. And we start off by not believing in forecasts. We take it day by day and see what happens.
Nonetheless these two methods augur well for a bull trend, and there is a Dow Theory buy signal. Ignore, in addition to this letter the talking heads who are saying that we are in a secular bear market. They will be left at the station waiting to catch the train in the opposite direction.

