 Continuing to cause indigestion amongst technicians and the cognosenti, volume refuses to cooperate with conventional wisdom. Perverse indicator. Everyone knows that volume goes with the trend — or supports it — or does not diverge from it. Meanwhile those shells keep moving too fast to keep track of. So those who worry about these things are fretting on the sidelines while the market continues to “levitate” ( we think it was Larry McMillan who said that) implying some other kind of trickery than shell games. Nervous traders who fear that the market magician will saw the market in half point to it as a reason not to be in the market. Rigid ideology will do that to you.
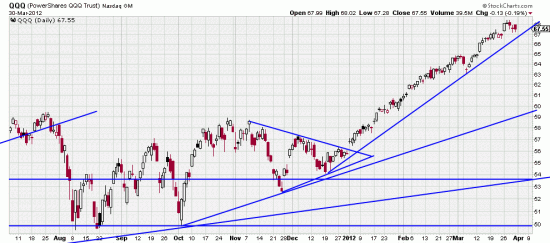
In fact that belief (or totem, or sacred thought, or religious icon) is just a shell and the pea (=P=Price) is scooting around the corner taking the mark’s money. Sometimes volume matters and sometimes it doesn’t matter. When the SPX is up 12% for the quarter and the NASDAQ 18%, you’re watching the wrong shell if you didn’t participate because of vapors about the volume.
Speaking of vapors, the whole world has the vapors about this wave which has now lasted about 130 (m/l) days since inception and 80 days on this leg. What on earth is going on that the inevitable correction hasn’t set in. (This is of course the classic boarding house problem of waiting for the other boot to drop.) Here are some possible explanations.
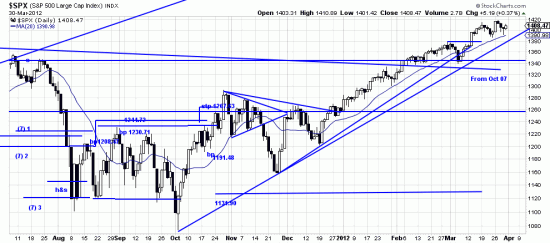
First, and of supreme importance, the bull market is starting. Second, this wave has been insidiously quiet and low key. It has crept up at a snail’s pace and avoided the nemesis of the contrarians and bear raiders. How can you not like such a friendly little puppy which doesn’t excite aggression by overreaching? Third, this crawl upward has offered a number of down days which might have snowballed into serious corrections. This has been healthy. Fourth, the public (the unwashed public) is not in the game, so the market is toying with their emotions. It’s difficult to really have fun with a correction or downwave unless you’re making the public pay (the Charlie Brown syndrome — where Lucy removes the football.)  Then, the market is (SPX) is very sound technically. The trendline on this latest wave is too tight to last and too steep to be really important. Something (minor) will happen when it is broken, but the really important trendline (from Oct 4th) gives the market very generous space. A break of that line could have serious consequences.
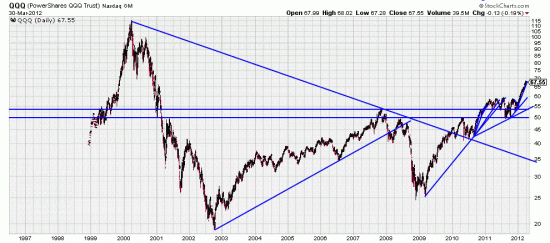
In our first chart we point out something which we recently noted about the SPX: that in the Qs the long term downtrend line from 2000 (!) has been broken. And prices are in the clear above the 2007 top. While there will be vestigial resistance from those thrilling days of yesteryear, internet companies now have real earnings (they tell us) and the technical picture is extremely bullish.
In the second chart you see something you never see in our charts — a moving average line snaking up underneath prices. This is a sacred object worshiped by some technicians, a 20 day moving average. Some technicians think this is the magic line which turns stocks into pumpkins when penetrated. As lovers of pumpkin pie let us say we do not worship this pumpkin — but do not disrespect those who do find it possessed of sacred mana. We illustrate it here so that you may be aware of it. Sometimes these things have a self fulfilling nature. A nervous tic and possibly a frantic reaction might occur if the line were broken.

