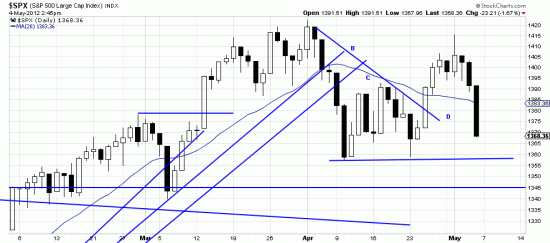
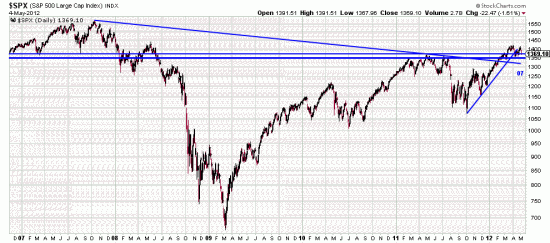
 We were looking at this chart willing it to tell us how far down it was going to go and Lo! and! Behold! it did. The short horizontal trendline at (m/l) 1356 looks like the support area, then we asked ourselves where that longer horizontal line came from, which set us searching year charts. Serendipity occurred. Turns out that short line is just the latest expression of a top in July of 2011 which represents a bulwark of support.
  Numerous technical phenomena are coinciding in the present and over the recent past. As we have recently pointed out the downtrend line from 07 (a powerful line) has been broken. The two long horizontal lines at 1356 and 1371 are also recently broken. The 1356 represents deep support for the present downwave. The 1371 represented an important resistance point. It is completely normal for prices, after breaking these important lines to “throwback” (analyst jargon). That is caused by short term traders who take profits and also bet on regression to the mean. Their psychological intent is to spook traders and investors on the other side of the trade. (The unwashed and unworthy, as we have characterized them.)
After being spanked Friday readers would be (as we were) chagrined. But not a jot has changed in our mid and long term analysis of the market. The only substantive lesson here is that investors who believe in market nostrums like “Sell in May and go away” will be taught to ignore rhyming threadbare wisdom and concentrate on the reality of the immediate chart.

