 http://stockcharts.com/h-sc/ui?s=$SPX&p=W&yr=4&mn=0&dy=0&id=p23979716543&a=268628380
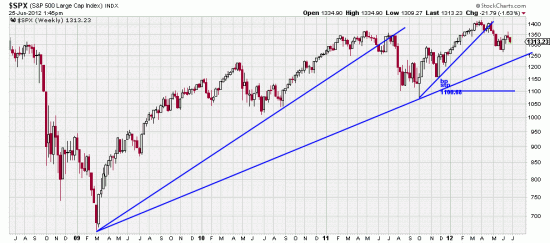
An interesting technical question is: Are we still in the aftermath of the break of the Mar 09 trendline? In this weekly chart we see a substitute long term trendline develop from the March 09 bottom. That line effectively defines the roaring bull market we have had since the Mar 09 bottom. The breaking of that line would be catastrophic. We could also argue that the October 10 wave low would have to be broken too for the sky to fall. The long term weekly Basing Point stop line is quite close to that low.
Meantime the point and figure charts have bullish targets (Dow 13200, SPX 1550). Meanwhile Richard Russell claims that the Dow Theory has signaled a primary bear market. It is always a bad idea to bet long term against Dow Theory. It is also often a bad idea to bet against the PnF chart. Battling arrows. Also we are a little skeptical of Russell’s call. We are really waiting to see if we get a long term sell signal from the Basing Points procedure which is much easier to interpret.
http://stockcharts.com/h-sc/ui?s=$SPX&p=D&yr=1&mn=0&dy=0&id=p20970412253&a=266691158
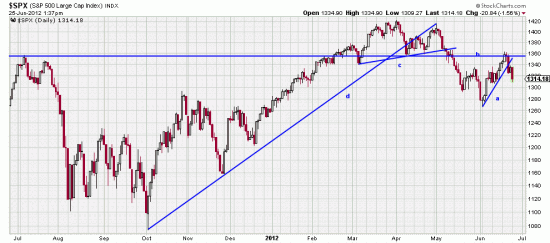
Meantime the a trendline here is broken by the air pockets we have hit the last few days. Readers will remember our insistence that broken trendlines always have consequences. The consequence of this may be a test of the June 4 low. Regardless the net effect of all the arrows pointing in different directions means near term turbulence with the exit from this period in total doubt.
Of interestr in this chart: b trendline shows the powerful resistance that prices just ran against. You can see how long it is. And it is powerful. Break that and there will be a powerful upwave. We are now paying the bill for the breaking of the c and d trendlines.
And then of course there is always the Supreme Court health care decision. Expect turbulence.

