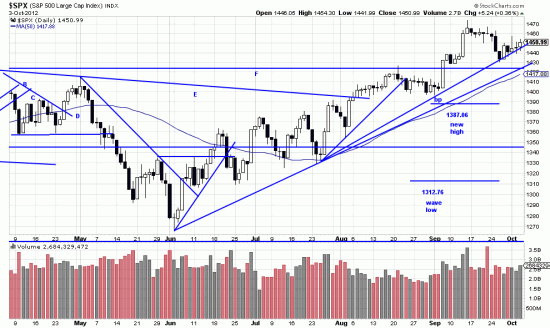
 http://stockcharts.com/h-sc/ui?s=$SPX&p=D&yr=0&mn=6&dy=0&id=p97142210271&a=214966864
Let’s see. According to the old market nostrum we should have sold in May and gone away. Also we should have crawled in a hole and hidden during September as it is traditionally a difficult month. Of course these nostrums are in direct conflict with the zen precept of looking directly at the facts. As believers run around in circles and sit out the market because the economy is bad so the market can’t be good, or worry about sunspots or Greece or the election, or some other indicator they have that is not favorable, or because there was a divergence by the Dow Transports…or…
The story is told of the monk who went to see his master. He passed bamboo and a cherry tree and entered the teacher’s hut. Where he was smacked with the zen master’s stick. When he left the hut he saw that the tree was a cherry and that the bamboo was green. He could also hear the sound of one hand clapping.
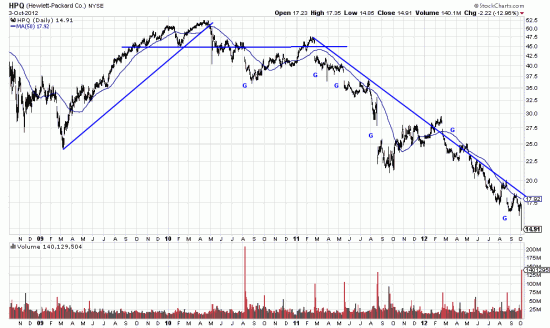
Since we don’t look at individual stocks we often miss belief stocks like Hewlett Packard. If readers called our attention we would look at them, but in general we think trading stocks is like handicapping race horses. ETFs are so much less risky and more convenient. Nonetheless there is a plethora of lessons in HPQ.
 http://stockcharts.com/h-sc/ui?s=HPQ&p=D&yr=4&mn=0&dy=0&id=p12538977951&a=279480058
Every one of the gaps marked here is a sell signal. And while today took HP down over 2% only a convinced masochist or non reader of our work would have been long. There are so many signals to sell and or sell short that the adventurous speculator could have sold short and pyramided and made a small fortune. The broken uptrend line, the horizontal line, each gap. And them the long downtrend.
Based on today’s action you could even dip a short toe into this issue, remembering always that long trends are to be handled with great caution.

