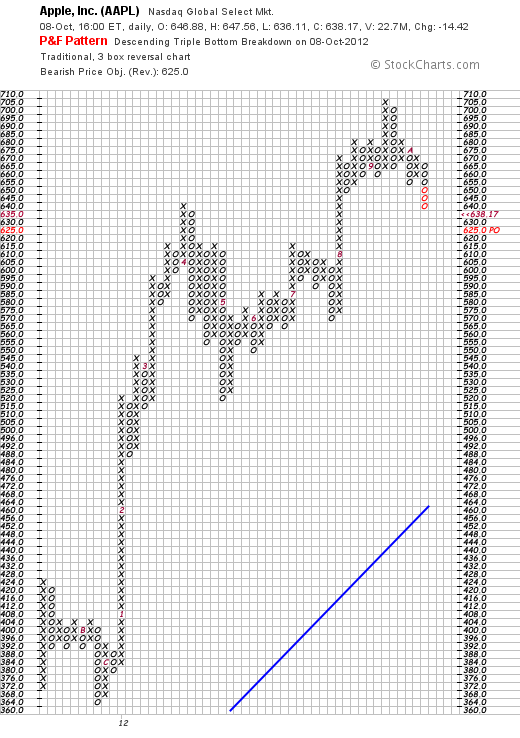
 We have always thought that Apple’s media following was like the following of Russian troikas in the winter. They have been howling at the company, especially encouraged by the death of Steve Jobs. While the long term prospects of Apple have not changed (and they just sold 5 million iphones on its release) and nothing has changed there is some change in the stock. Specifically the PnF chart of Apple has changed to a bearish forecast. Not much of a bearish forecast, 625, but in keeping with the present downwave.
 http://stockcharts.com/h-sc/ui?s=AAPL&p=D&yr=0&mn=5&dy=0&id=p44783049593&a=211388616
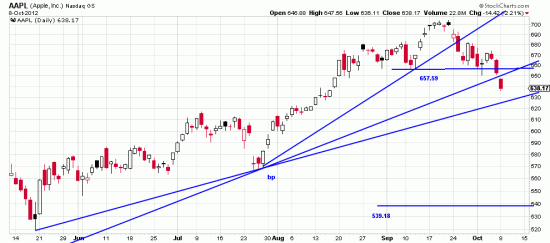
Here is our previous chart of Apple showing stops calculated from the highs and from wave lows. The stops are broken for traders and short term holders — and in fact for anyone who doesn’t want to see equity erosion.
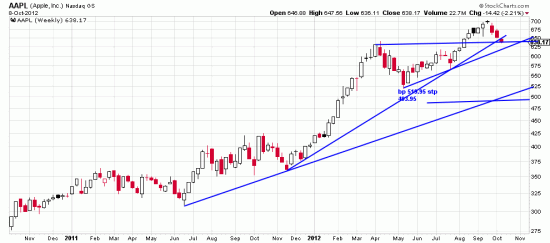
In fact the lower stop is out of range of the PnF target. There is yet another way to look at Apple –that is by analyzing the weekly chart which would give us yet another distant stop.
 http://stockcharts.com/h-sc/ui?s=AAPL&p=W&yr=2&mn=0&dy=0&id=p52505591390&a=279931009
This would be 483.95. What these analyses are telling us is that a historic trend must have significant space to avoid being ejected on the way to 1000. The present downwave is about 9% and is not out of keeping with Apple habits. Those who invest and trade in Apple periodically take it down to purge the trend. So readers should be reminded that it is almost always the long term trend followers who reap the largest profits and those who try to hop in and out wind up out — of luck.
There is of course always scaling out –that is selling off a unit, or two of the position. We always like this technique — it swings naturally with the tides of the market.

