 http://stockcharts.com/h-sc/ui?s=$SPX&p=D&yr=0&mn=6&dy=0&id=p33682367285&a=214966864
After 8 days of shifting from one foot to the other the market finally took a step. In the right direction. Prices today crossed the resistance horizontal line. And while we only include it for reference prices have broken above the 50 day moving average. Many analysts consider this significant. We always consider it in the context of the rest of the chart. This chart says “buy me”.
We still regard this situation with caution. If Congress manages to sabotage the political deal god only knows what the market will do. For the moment the market is saying that it looks as if a deal is in the offing. If the whole thing doesn’t send you into a homocidal fury you are lot more calm than we are.
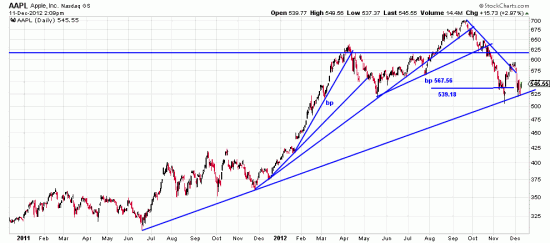
The index is not the only buyable. It looks to us like the long term trendline is supporting Apple and we think the downwave has run its course.
 http://stockcharts.com/h-sc/ui?s=AAPL&p=D&yr=2&mn=0&dy=0&id=p41389696748&a=256938322
Worth a trade. As always a 5% stop.

