http://stockcharts.com/h-sc/ui?s=$SPX&p=D&yr=0&mn=6&dy=0&id=p16768279576&a=214966864
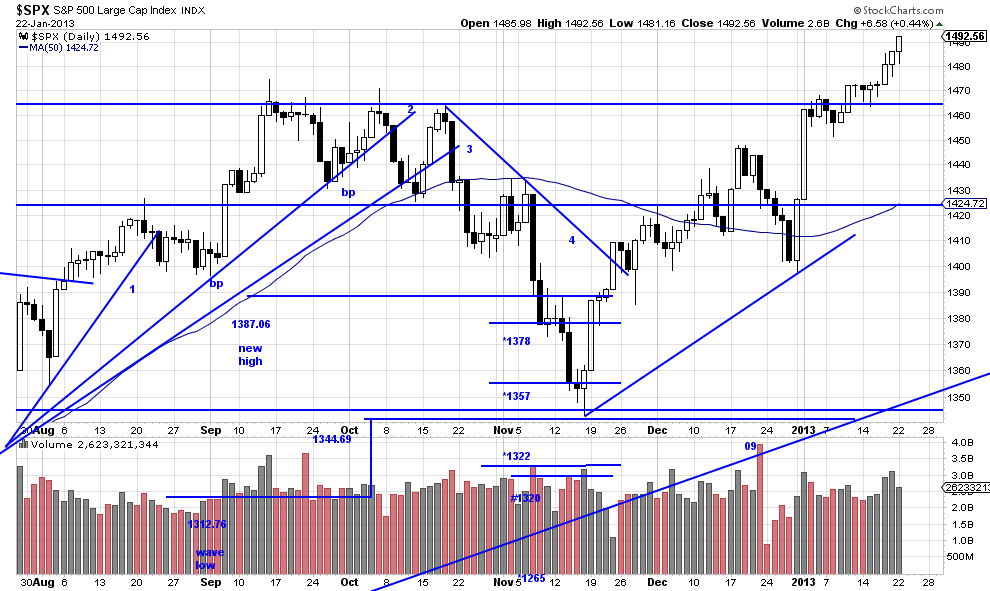
Well, maybe it was a flag. It’s acting more like it now. You know — for a flag you have to have a flag pole. that usually means a lower section, the flag itself, which ought to drift lower and the upper section, which ought to be proportional and similar to the lower section. But this bastard variety seems to be composed of strong power bars on the upper section. This could be good, in that flags tend to finish waves — in general, insofar as any certainty exists in these markets. There is a sniff of parabolic move here. That also finishes waves.
We took two measurements in the recent past — one from this “putative” flag, and the other from the reverse (Kilroy) head and shoulders. There was a happy synchronicity in the measurements — they were each within a hair of 1525. While we always caution against depending on these measurements it seems with prices going to new highs and favorable measurements all around that we should see a continuing wave up here.
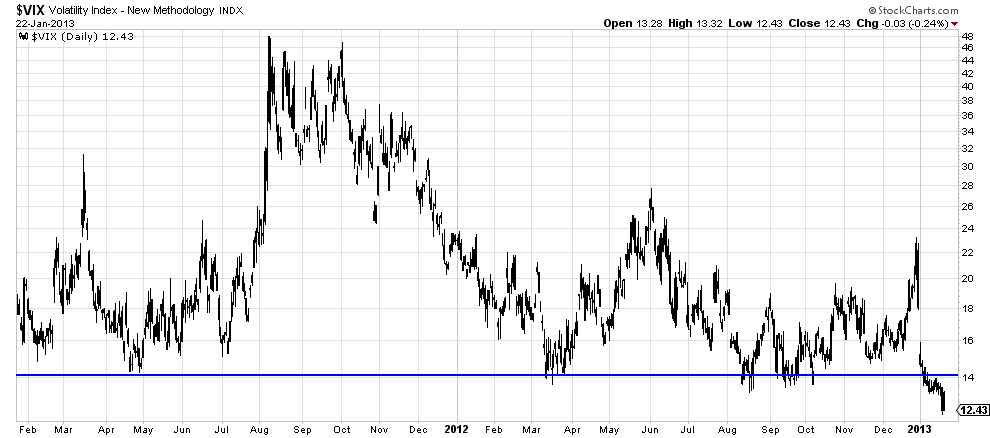
Clouds on the horizon should be mentioned — this latest move is beginning to look parabolic — always a sign of wave endings, but one never knows where the parabola turns into a parachute. Then there is the ominous state of the VIX which has gone to new lows. Remember that volatility reverts to the mean, and sometimes that mean reverting is cruel:
http://stockcharts.com/h-sc/ui?s=$VIX&p=D&yr=2&mn=0&dy=0&id=p41162422464&a=222753802
And, like finding the top from the parabola, finding the bottom of the VIX can be a dicey business. Readers are best to continue to observe the long term stops and let the HFT (high frequency traders) go broke trying to out maneuver each other. And more power to them.


