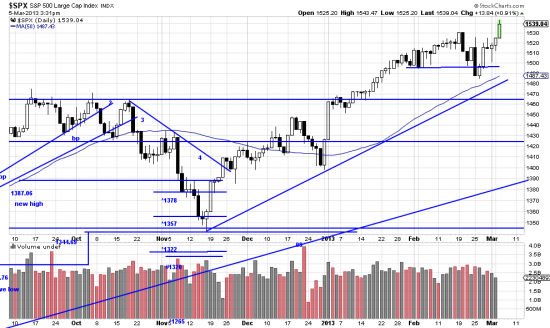
 http://stockcharts.com/h-sc/ui?s=$SPX&p=D&yr=0&mn=6&dy=0&id=p16768279576&a=214966864
Don’t celebrate yet. Breakouts are always subject to confirmation. But this certainly looks like the real thing, and we added on to our longs, taking the first of several tranches in the Dow (DDM, actually). This should however shut up the incessant niggling about being in a secular bear market. (Boring.) Adding on, of course, is the classic pyramider’s (or position builder’s) dilemma. The market with its hypersensitive nose knows that you have done it (notice the nose knowing) and punishes you. The technical reason for this is that some traders are taking profits, and there is another school which delights in selling strength and especially breakouts.
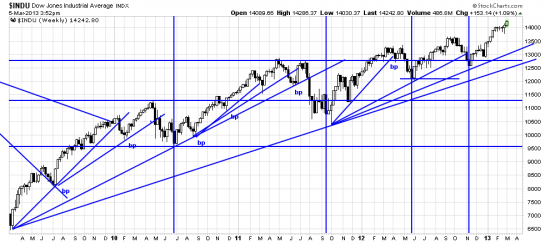
A better long term look is presented here with the INDU.
 http://stockcharts.com/h-sc/ui?s=$INDU&p=W&yr=4&mn=0&dy=0&id=p14903824659&a=205853690
We have marked here (as we have before) the major waves in the market. It appears that we are surfing a new wave. Notice that in the case of every downwave here that an important trendline was broken prior to the downwave. Notice that fact again. It is the basis of trend analysis. Pretty simple, eh?
An interesting aspect of breaking through to new highs is that there is no known resistance above us. Sky’s the limit.


Any advice on where I can learn to construct trend lines such as this? I’ve read ‘Technical Analysis’ already. Thanks.
my seminar at GGU begins in May. Otherwise take the blank spx and indu charts and mark them up and then compare your work with the posted charts. More to this question later.
cb