 http://stockcharts.com/h-sc/ui?s=$SPX&p=D&yr=0&mn=9&dy=0&id=p20049953156&a=214966864
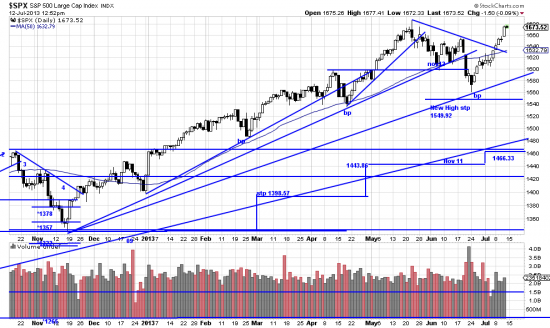
Often it is not just what happens, but how it happens. Yesterday prices powered up on a distinctive power bar to close at a new high. New highs make many investors nervous — and afraid to buy or increase their commitments. But pros know that prices at new highs represent prices with no defined resistance overhead. We are great believers in adding on to commitments. In long trends it hypos performance, and is IN FACT the least risky time to be all in. The probability of loss is reduced when you ride with the long trend. MPT (cooked up in an academic lab) didn’t (and doesn’t) know anything about trend analysis.
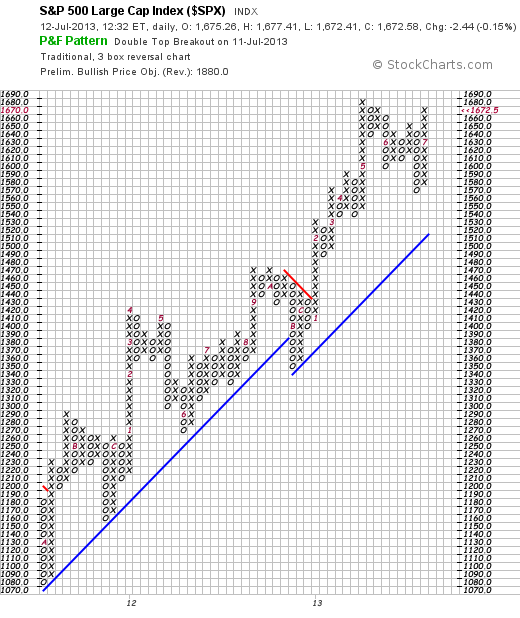
Good. We get to enjoy taking their money. And we may get to take a lot of it if the PnF chart proves out:
The chart is displaying a target of 1880. Do we believe this? Yes and we believe in the tooth fairy too. How many times do we have to say that we are total atheists — in fact it’s a wonder Pope Francis is not coming after us to burn us at the stake. We don’t believe. We analyze. And the analysis says that we are in a roaring trend, and that the likelihood is a strong continuation. It is a little bit of a mystery to us — what with Congress doing its best to throttle the economy. Thank Allah for Ben.
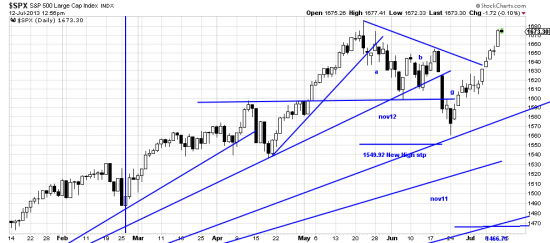
Our basic chart is so marked up that we include a close up. Note how far away the trendlines are — and also note that a new Basing Point is in evidence with a stop at 1466.71. The old new high stop remains though we think it is a little close. At least it serves as a tripwire.
http://stockcharts.com/h-sc/ui?s=$SPX&p=D&yr=0&mn=6&dy=0&id=p62522442878&a=266398464


