 http://stockcharts.com/h-sc/ui?s=SLV&p=D&yr=0&mn=9&dy=0&id=p15218233755&a=236108789
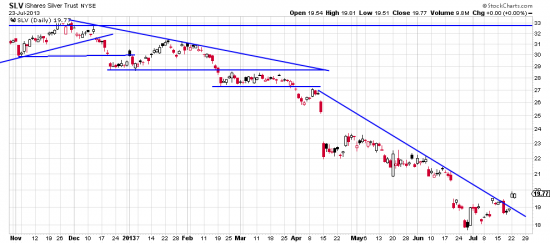
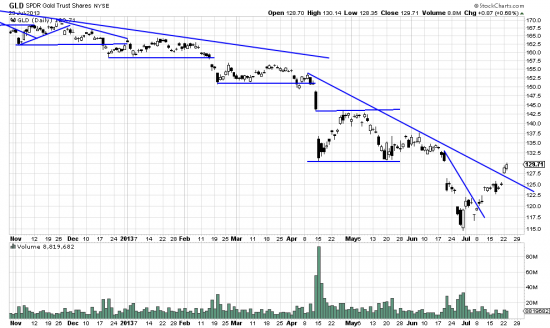
Silver gapped across the downtrend line. A clear signal. Note that even clear signals don’t always result in profitable trades. On the other hand trades made without signals are much more likely to be losers. Market rumor has it that the hedge funds are squeezing shorts. Not known if these are boxers or jockeys. We laid down a small unit bet on silver. As we did with gold which has a similar chart.
http://stockcharts.com/h-sc/ui?s=GLD&p=D&yr=0&mn=9&dy=0&id=p79177025382&a=255869372
FXE is also on the rise. We are not sanguine about silver and gold but we try to ignore our bloody emotions and do what the chart says. We actually think the metals should decline some more — but…the markets will do what they do…. won’t they?


Please forgive my naivete if there is a glaringly obvious answer to my question. I am as new as a newbie can be to the 10th edition and this site.
With respect to the GLD chart, why is the recent activity not simply a recovery to the horizontal line drawn at about 130? As I read page 190 in the 10th edition, support becomes resistance. Down to 130, up to 143, down to 115, up to 130.
Does a gap across a trendline trump normal trend development?
Thanks in advance.
No question is unworthy of serious consideration. Gold is in a long downtrend. A downwave. Rallies in this trend create upwaves. These as noted tend to crest at previous support levels. In general we can say that every wave is followed by a wave in the opposite direction — or a side wave. The present up wave in gold, 23 days, is completely normal. The previous wavelet ended with a side wave. You could call it a recovery. Or bottom fishing by gold bugs who resist recognizing the situation. A gap across a trendline is very often very significant — we just had one in gold but it doesn’t necessarily trump the trend. Gap interpretation is actually a pretty complex and subtle science. I will write a letter on gold shortly. Meantime I applaud your studies.
cb