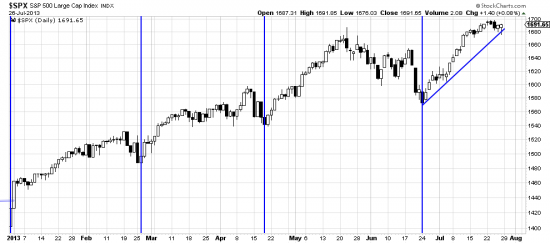
http://stockcharts.com/h-sc/ui?s=$SPX&p=D&yr=0&mn=7&dy=0&id=p10149991945&a=259588108
After 22 days and and 8% wave prices have reacted across the wavelet trendline. As we have often pointed out it is the length of the trendline which is important. In this case a broken 22 day trendline would not portend much grief. But we never say never. What is going on at the moment is prices are meeting news resistance and the old high resistance. This is completely natural after an 8% wavelet.
Looking at the vertical lines defining previous wavelets we see, from the left, waves of 36, 32, and 24 days. Each has terminated with some sort of downwave, however brief, until the penultimate which finished with the June downwave which made everybody (but us) queasy. It seems to us that we are watching a very orderly bull market in progress. We are waiting for a confirmation of the breakout — a sign of strength — to tell us to increase commitments. We will point it out when it occurs.
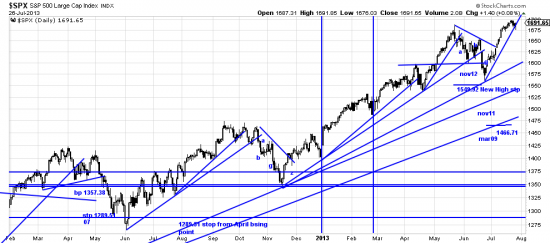
Below the chart with a plethora of trendlines and stop lines:
http://stockcharts.com/h-sc/ui?s=$SPX&p=D&yr=1&mn=6&dy=0&id=p43199796180&a=266398464
Over the past 25 days note prices accelerating. This could be a cause for concern, but we see the market slowing itself down here. And coming off the correction of June less concerning that could be. What really concerns us is the fact that our SPX (UPRO) position has almost 72% profits in it. From long experience we know not to celebrate equity highs. The market knows and is watching. The minute you get giddy the market takes you out behind the woodshed and whales the begesus out of you.


