http://stockcharts.com/h-sc/ui?s=$SPX&p=D&yr=0&mn=9&dy=0&id=p20049953156&a=214966864
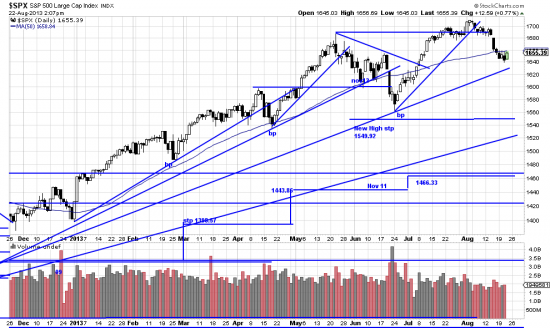
Our faithful friend and the usual suspect with trendlines and stairstops. This is especially needed at present as talking heads, pundits and commentators desperately seeking attention rant on about S&P 5500 and blah blah blah. Indicators and sunspots and full moons and failed Lone Ranger movies (sob — a more bitter disappointment than the market) Kim Kardashian gone to bubble, a Giants collapse — what does it all mean? Well there are a couple of “indicators” worth noting: the NYSE advance decline line not confirming the market high and the Fosback High Low indicator flashing sell signs.
Investors and traders who let their discipline be blown around like 72 foot catamarans on San Francisco Bay deserve what they get. What they get is truncated profits and the pleasure of running with the herd. The trend is intact. Now for the pop quiz. Class, what is a bull trend? A+ for everyone who was paying attention — higher highs, higher lows.
http://stockcharts.com/h-sc/ui?s=$SPX&p=W&yr=1&mn=9&dy=0&id=p77020863423
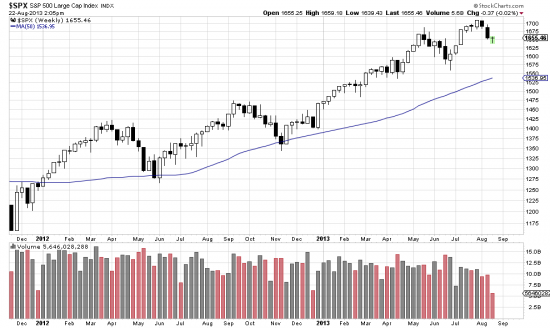
Viola the weekly without any messy lines. Weeklys are more powerful than dailys. They filter out more of the noise. Remember the mantra taught us by the Indian gurus (Sioux): wave up, wave down, wave up, wave down….until the tide changes.
Be assured. Nobody is watching the tide tables more closely than ourselves. Stop worrying about black swans and purple ducks and turn on the Open.


