http://stockcharts.com/h-sc/ui?s=$SPX&p=D&yr=0&mn=9&dy=0&id=p20049953156&a=214966864
It always amuses us to watch the chicken littles run around like the sky is falling. And sometimes there is something to be learned by the way they rush into or out of the market. We usually speak of them as being a herd, but perhaps in this case they are a flock — at least they are flocking to the oil trade, and also pinching our toes in the short bond trade. All in all the market is not reacting bullishly to the Syria news or non-news — or faux news.
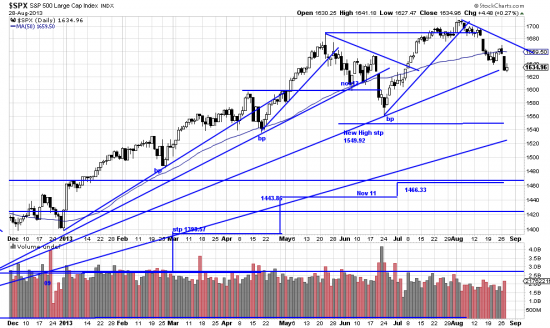
Withal with the news, whatever it is — the SPX is down only — top to bottom — 4% (4.7 if you want to get precise). As can be seen by our guiding chart it’s a long way to real trouble. And (or but) the trendline from Nov 12 is either support or a danger signal. So far so good. Now for a little analysis. If you look at this downwave it looks a lot like our alpha-beta-gamma pattern (with zeta presumably to come). In which case we are in the gamma wave.
A 3% break of the Nov 12 line would get us into serious defensive mode. We are already partially hedged but that would rattle our cage. More patient readers will probably profit by regarding this as an opportunity to observe chickens running about worrying about the sky falling. And there should be a really good short of oil when the news nonsense has run its course.


