http://stockcharts.com/h-sc/ui?s=GLD&p=D&yr=5&mn=0&dy=0&id=p31723949560&a=290122392
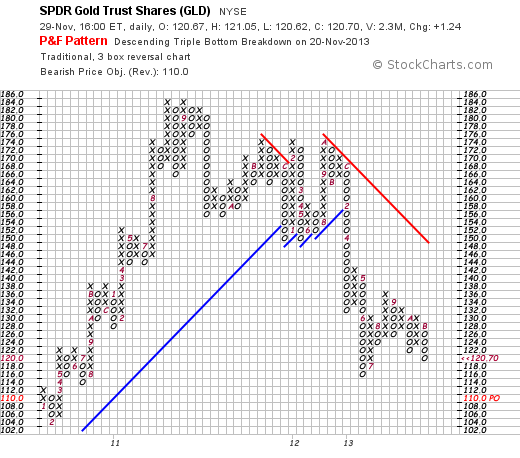
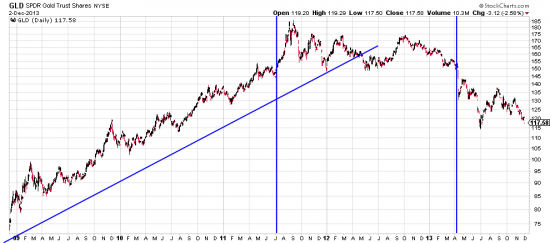
The question is not whether gold will go down, but how much. As always analyzing these things is tricky but ever one to step on thin ice we set out to try to get an idea of it s short potential (we are short). If you measure the top formation you get a depth of 37 (m/l0. The bottom of the formation is at 148, so if you fulfilled a normal E&M measurement you would get a target of 111. The PnF chart agrees with this:

(no link see stockcharts.com)
The PnF thinks 110 is a reasonable target. Actually we think there’s more to this analysis than meets the eye, but for the moment all the methods say there is more to be had. We think that perhaps there is much more. Much. Which we will address in a soon to come letter.
Apple is throwing off buy signals. We think the fundamentals AND the chart say it’s a good buy.
Happy Holidays. It looks like the markets are in snooze mode, but the market is vulnerable to a bear attack because all the real traders are skiiing in Aspen and St. Moritz. We will of course be watching for market mischief makers.


