http://stockcharts.com/h-sc/ui?s=GLD&p=D&yr=0&mn=9&dy=0&id=p79177025382&a=255869372
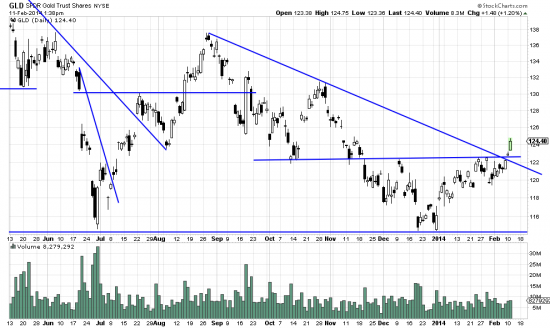
We love to be on the train as it pulls away from the station and we wave at investors with opinions and beliefs standing on the platform convincing each other that –as the passing chicken has persuaded them– the sky is about to fall. Instead there is a plethora of issues to buy. We found ourselves thinking that we thought that gold would go to 800. The instant we heard our brain say we think we grabbed the crystal ball on our desk and smacked ourselves upside the head and reminded ourselves of the mantra that Swami Muktananda taught us: Don’t think. Analyze. The chart says that gold is breaking out. Furthermore there well could be a double bottom here. Consonant with this, GDX, the gold miners is a buy .
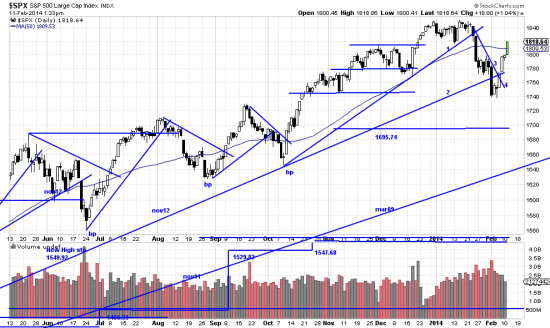
The basic chart shows the state of the market:
http://stockcharts.com/h-sc/ui?s=$SPX&p=D&yr=0&mn=9&dy=0&id=p83750808625&a=214966864
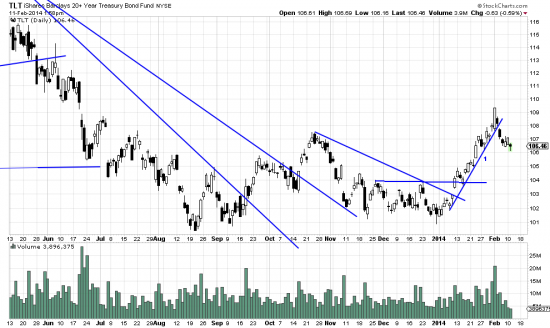
Must be an a-b-g-z pattern from the way it’s taking off. But TLT, on the other hand looks like it has exhausted its upwave here.
http://stockcharts.com/h-sc/ui?s=TLT&p=D&yr=0&mn=9&dy=0&id=p93822624124&a=261274354
While, once again there might be a double bottom here we have a new Fed chairwoman and who knows what that means. We’ll short a little of it (with TBT) and see what that does.
Other issues worth buying are MOO and AAPL. We’ll write a separate letter on Apple shortly.
Meantime pay no attention to that fellow behind the curtain who is trying to attract attention to himself by waving that sign that says the present market pattern is a perfect analogue (it’s not) to the 1929 market. He’s just trying to get the people on the platform excited.


Pingback: Betwixt and between… | Technical Analysis of Stock Trends