http://stockcharts.com/h-sc/ui?s=FXE&p=D&yr=2&mn=6&dy=0&id=p15634041017&a=216019099
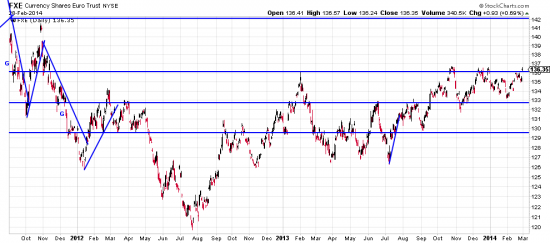
The euro not only gapped above its nearby highs it gapped across a long term sidewave high. We bought a little of it, scaling in.
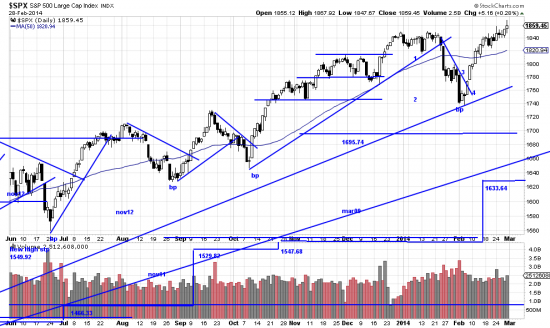
Meanwhile, back at the chicken coop the market recorded a bizarre day, transversing 20 SPX points. First surging to new highs and then plunging as if it had fallen off the table. Then late in the session bouncing off the bottom like a super ball. Bizarre. We are shaking our network tree to see if any ex-students (professional managers and traders) can explain it. At the very least the fact that the market could be hammered so badly and then recover reinforces the bull case. We added on to our UPRO position (leveraged SPX). In a simple portfolio of UPRO which has not been affected by position building the accumulated paper profit is 98%.
We still have colleagues (amazingly enough) who are short the market or out waiting for 1929 to redux. It reminds us of Ed Seykota’s remark that he couldn’t believe how long it took him to believe what he was seeing. As the great zen master Zeninu Basho said the chart is the picture of one hand clapping.
http://stockcharts.com/h-sc/ui?s=$SPX&p=D&yr=0&mn=9&dy=0&id=p83750808625&a=214966864
Complain though we might about the frequent down waves (wavelets) this chart is the picture of a healthy controlled market. Anyone who thinks is is a dangerous oversold or parabolic runaway market is looking for love in all the wrong henhouses.


