http://stockcharts.com/h-sc/ui?s=$SPX&p=D&yr=0&mn=3&dy=0&id=p96206718625&a=214966864
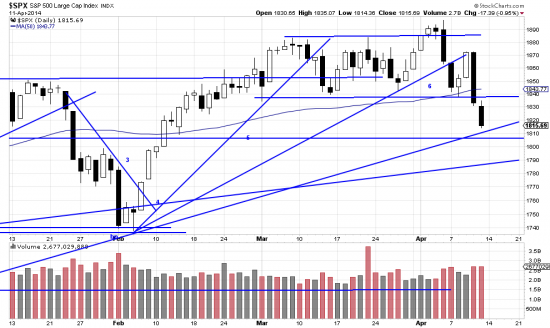
The market is sliding along the razor’s edge. The SPX is only 9 points from the important trendline of nov12. The formation has certain aspects of an alpha-beta-gamma pattern (or ABC) with the present wavelet in the gamma (C) phase. Penetration of the nov12 trendline would be serious and might be the precursor (if that has not already happened) of a painful downwave. We are presently somewhat hedged and certainly would fully hedge if that happened. And perhaps even go net short.
http://stockcharts.com/h-sc/ui?s=$SPX&p=D&yr=0&mn=10&dy=0&id=p44872926553&a=214966864
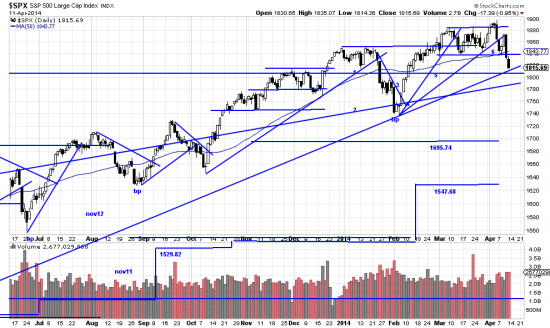
The new high and wave low stops are shown here. Violation of the wave low stop might signal a severe bear market. Violation of the new high stop would be a signal to cut back or hedge in full.
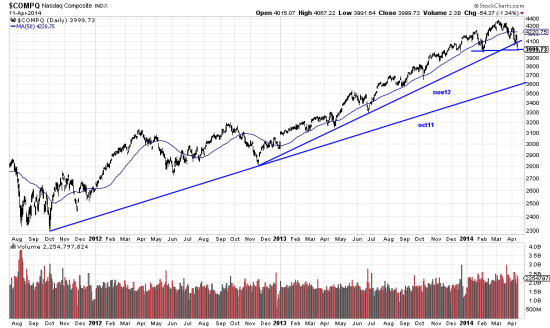
The market has had a hole shot in it under the water line with the foundering of the Compq. (In fact one might short that as a means of hedging.)
http://stockcharts.com/h-sc/ui?s=$COMPQ&p=D&yr=2&mn=9&dy=0&id=p65458040894&a=325314459
This issue is already breaking the nov12 trendline and is being battered in the market.
Readers now have the choice of sitting out this skirmish — which we estimate might be of painful but short duration — with for certain a strong bull to follow. Or lightening up their portfolios. Or hedging — with puts or inverse ETFs.
We will do some noodling over the weekend as to what exactly is going on — though this letter tells what is going on technically.


Dear Prof. Bassetti,
I am a new subscriber. Is there a newsletter that you have written in the past about the ‘big picture’ which discusses secular bull or bear market?
There are quite a number actually. They are all in the archives. Here is one: http://www.edwards-magee.com/?p+4512. I will update these soon — but– spoiler alert– we are in a historic bull market generally, and specifically at an inflection point where there should be a sharp correction. I’ll also look for some more links from the past.
cb