http://stockcharts.com/h-sc/ui?s=$SPX&p=W&yr=5&mn=0&dy=0&id=p38441387569&a=321281297
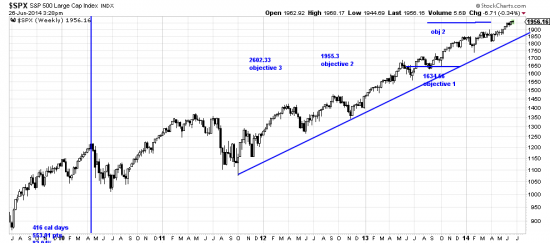
While absent-mindedly noodlying in Oct 12 it occurred to us to run a rule of seven analysis on the SPX. (http://www.edwards-magee.com/ggu/ruleofseven.pdf.) The market was about 1450 at the time, and our analysis set target objectives of 1634.56, 1955.3 and 2602.33. In Oct 13 we updated the chart as the first objective was met.
Now the second objective, 1955.3 has been achieved and we have updated the chart. As always we disavow prediction and forecasting, choosing instead to do only what the chart dictates at the moment. At this moment the chart says: stay long.
(no link)
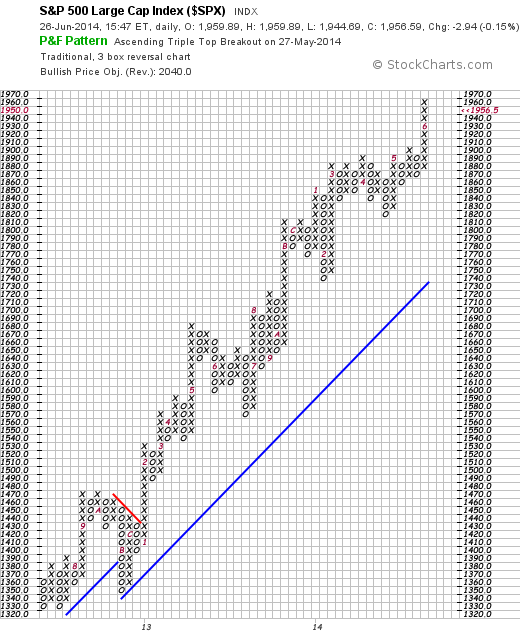
The PnF chart is in substantial agreement, though it target is only 2040. Remember, neither of these methods is infallible and neither specifies how much blood sweat and tears will be shed on the way to the objective.
In general we try to avoid provocative statements and just stick to the facts. But we are slowly reluctantly beginning to think that we may be in the bull market of our lives. Not to get excited, but to adhere to good practice as a burr sticks to the tail of a burro.


