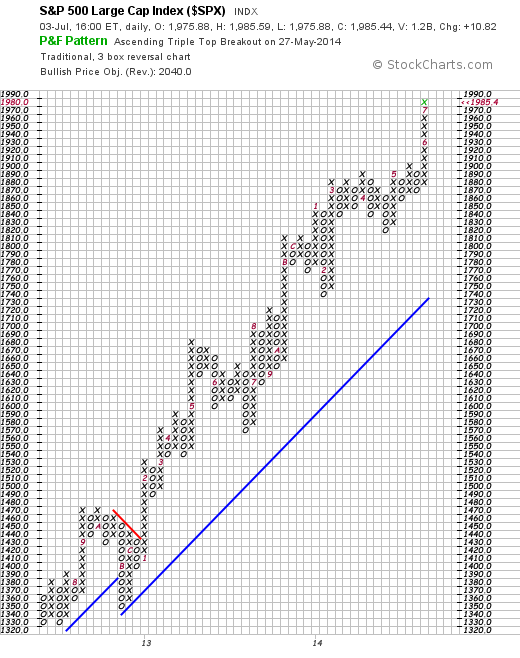
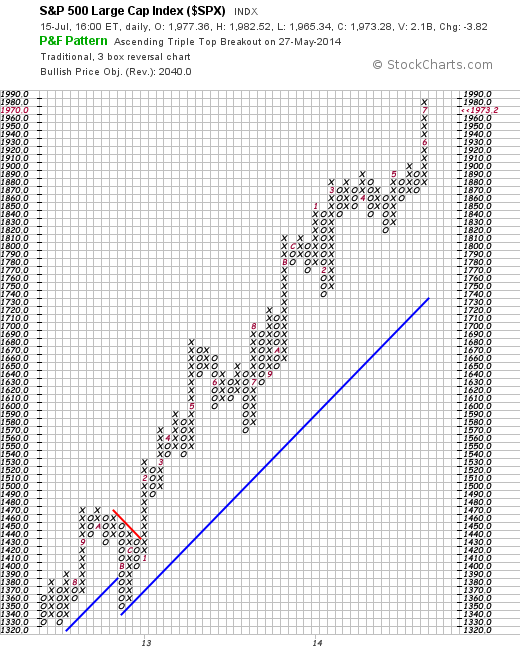
As the PnF chart thinks we are still in the bull market with a target of 2040. Do we believe it? Come now. How many times have you heard us say that we are total agnostics? It is true that we have constantly used the PnF chart to update targets going back hundreds of points. But don’t all good things end? Well, all things end. All things end in change and suffering. Uh-oh there we go dipping into Bhuddist philosophy again. Stop us before we philosophize again. Of course there are those who believe the market is a machine for masochists. It has certainly put the thumbscrews to us at times in the past. Nonetheless…
Every once in a while Marketwatch publishes –interspersed with unbelievable amounts of trash – an interesting article. Shortly they interviewed John Templeton and Laszlo Birinyi on the state of the market –or states of the market. Each identified four states of the market: Templeton: Pessimism, Skepticism, Optimisim, and Euphoria; Birinyi: Reluctance, Digestion, Acceptance, and Exuberance. Birinyi believes that we are moving into the fourth state. Obviously these start at the bottom of a bear market.
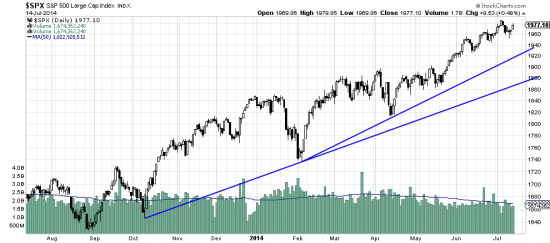
He must not be watching the chart. Prices floating upwards with quiescent volume. Around 50 (+) days without a price change day greater than 1%.
This exercise has about as much relevance as working on the question of how many analysts can dance on the edge of an exacto knife. The chart tells you all you need to know, and it says Stay long.
Our tentative states are 1. Pain, Disillusionment 2. Healing Temptation 3. Tentative Reengagment 4. Trust 5. Active participation 6. Enthusiasm. If anything we think we are in state 3.
But perhaps in the present case we have a Mark Twain’s cat market. He noted that once his cat sat on a hot stove and after that would sit on no stove at all. This as far as the general public is concerned. Lately rumor has it that the public is reengaging with the market (get the nets!) and this boogie man is being used to signal (contrary indicator) exit for pros.
We took out our detective kit and looked around for the public and couldn’t find them. Low range price changes and low level volume doesn’t look like the public we know and love. Here is a chart showing a moving average of volume. You will note that the moving average line is declining.
http://stockcharts.com/h-sc/ui?s=$SPX&p=D&yr=1&mn=0&dy=0&id=p29081416949&a=359411872
Now where did that damn cat get off to?


